SPSS EXAM:
T-test:
Independent samples t-test: between subject’s
design (difference between 2 groups)
o Dependent variable: interval/ratio scale
o Independent variable: nominal scale
(indicates group)
Paired samples t-test: within subject’s design
(difference between 2 groups)
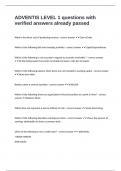
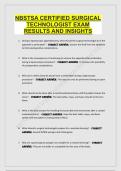
Table:
o t: turns the observed difference into relative difference (is
divided by a measure of variation called the standard error)
observed difference in means/standard error
Correlation:
Correlation: a measure of association between two continuous variables (2 variables)
o Assumptions:
There is a linear relationship between independent variable (IV) and
dependent variable (DV)
Measurement level: DV continuous, IV
continuous
o SPSS: analyze, correlate, bivariate now choose your
variables
Choose between Pearson’s or spearman’s rs:
Pearson’s r: most used. It measures a
linear correlation and can be used when
variables are measured on a continuous
scale, like weight or length
Spearman’s rs: can be used when
variables are measured on an ordinal
scale, for example a 5-pointscale like
‘strongly disagree’ to ‘strongly agree’
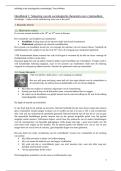
Interpreting Correlation coefficient:
Look if the correlation is positive or
negative
What is the size of the correlation
coefficient (between -1 and +1)?
Look at the p-value if it is significant
Regression:
Regression: relationship between an independent variable and a
dependent variable
o Type of relation: regression
o Strength of the relationship: Pearson correlation
coefficient
o Multiple linear regression is used when we want to
predict the value of a variable based on the value of two
or more other variables (3 or more variables)
involves 1 outcome (Y) and multiple predictor
, SPSS: analyze regression linear add your first set of variables in the
box click next to add another block of variables under ‘statistics’ click
R-squared change click OK
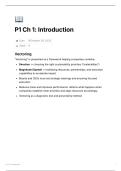
Output:
o 1st table shows what the independent variables and dependent
variables are. Specifically, for each model (1 and 2)
o 2nd table shows again the general quality of the regression
model the left part of the table contains information about
the quality of each model (in separate lines). The right part of
the table contains the change statistics. These statistics show
how the quality changes as we move from one model to the
next
o 3th table shows the results of the two F-tests that test whether
the models as a whole are significant. In this ANOVA table,
we only look at whether the models on themselves are
significant. Previously, with the Sig-f change, we specifically
tested whether the increase in explained variance was
significant, as we proceed from model 1 to model 2
o 4th table provides information about the regression
coefficients
Dummy variable: we use this for example by gender (1= male & 0= female).
We turn categorical variables into dummy variables
Can only be 0 or 1
How? count the number of groups that your variable has and subtract
1 of then (= number of dummy’s you need)
o Create the dummy’s
o Choose which group becomes you reference group (= 0 for
all dummy’s)
o Then give every value – one by one – the value 1 and the
other values a 0
o Name your dummy’s
SPSS: transform recode into different variables
o Select the variable that you want to convert into dummy
variable and move it from the input variable to output
variable
o Give the dummy variable a name click change
o Under old and new values, it tis possible to indicate which
group should get which value for the dummy variable
o Under old value, indicate which value the group had on the
old variable, and under new value, indicate that this should be
1 click on add
o Under old value select system or user-missing and indicate
that under new value that these values must become missing
values on the new variable (system-missing). Click on add
o Then indicate onder old value that you want to recode all
other values and indicate under new value that they all get the
value 0. Click on add
o Click continue and then OK you have your dummy
variable in your data file
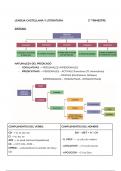
Formula:
, Assumptions:
o Independent observations
o Dependent variable should be continuous (interval or ratio)
o Independent variable should be continuous or dichotomous
(nominal with two categories)
Predictor can be changed into several dichotomous variables
(dummy’s).
o Linear relationship between predictors and dependent variable.
o Absence of outliers (in X, Y and XY-space)
o Absence of multicollinearity
o Homoscedasticity
o Normality distributed residuals
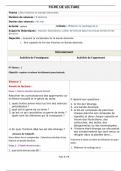
: the effect on predictor X1 on outcome Y is
different for different levels of a second predictor X2
(for example. when X2 is gender)
Regression equation:
Ŷ = b0 + b1×X1 + b2×gender
+ b3×X1×gender
SPSS: PROCESS choose model number
1 use options for centering and for getting
syntax that gives you the “mean +/- 1SD
plots”
o Centering: subtracting the mean
from each individual score, yielding an new variable, with a
mean of zero and the same variance as the original variable.
Makes the regression coefficients meaningful and
solves multicollinearity
SPSS:
Go to ‘transform’ compute variable
Provide a name for the new variable under
Target variable
Under numeric expression, define how the
new variable should be computed
Drag the variable you want to center from the
column on the left to the text box
Subsequently type “-mean”
(USE A DOT AS A DECIMAL SIGN.)
Click OK
o How to make an interaction term in SPSS:
Transform compute variable
Provide a name for the new variable under target
variable
Under Numerix Expression, define how the
interaction term should be computed:
Drag the centered variable from the column
on the left to the test box
Subsequently type “*”
T-test:
Independent samples t-test: between subject’s
design (difference between 2 groups)
o Dependent variable: interval/ratio scale
o Independent variable: nominal scale
(indicates group)
Paired samples t-test: within subject’s design
(difference between 2 groups)
Table:
o t: turns the observed difference into relative difference (is
divided by a measure of variation called the standard error)
observed difference in means/standard error
Correlation:
Correlation: a measure of association between two continuous variables (2 variables)
o Assumptions:
There is a linear relationship between independent variable (IV) and
dependent variable (DV)
Measurement level: DV continuous, IV
continuous
o SPSS: analyze, correlate, bivariate now choose your
variables
Choose between Pearson’s or spearman’s rs:
Pearson’s r: most used. It measures a
linear correlation and can be used when
variables are measured on a continuous
scale, like weight or length
Spearman’s rs: can be used when
variables are measured on an ordinal
scale, for example a 5-pointscale like
‘strongly disagree’ to ‘strongly agree’
Interpreting Correlation coefficient:
Look if the correlation is positive or
negative
What is the size of the correlation
coefficient (between -1 and +1)?
Look at the p-value if it is significant
Regression:
Regression: relationship between an independent variable and a
dependent variable
o Type of relation: regression
o Strength of the relationship: Pearson correlation
coefficient
o Multiple linear regression is used when we want to
predict the value of a variable based on the value of two
or more other variables (3 or more variables)
involves 1 outcome (Y) and multiple predictor
, SPSS: analyze regression linear add your first set of variables in the
box click next to add another block of variables under ‘statistics’ click
R-squared change click OK
Output:
o 1st table shows what the independent variables and dependent
variables are. Specifically, for each model (1 and 2)
o 2nd table shows again the general quality of the regression
model the left part of the table contains information about
the quality of each model (in separate lines). The right part of
the table contains the change statistics. These statistics show
how the quality changes as we move from one model to the
next
o 3th table shows the results of the two F-tests that test whether
the models as a whole are significant. In this ANOVA table,
we only look at whether the models on themselves are
significant. Previously, with the Sig-f change, we specifically
tested whether the increase in explained variance was
significant, as we proceed from model 1 to model 2
o 4th table provides information about the regression
coefficients
Dummy variable: we use this for example by gender (1= male & 0= female).
We turn categorical variables into dummy variables
Can only be 0 or 1
How? count the number of groups that your variable has and subtract
1 of then (= number of dummy’s you need)
o Create the dummy’s
o Choose which group becomes you reference group (= 0 for
all dummy’s)
o Then give every value – one by one – the value 1 and the
other values a 0
o Name your dummy’s
SPSS: transform recode into different variables
o Select the variable that you want to convert into dummy
variable and move it from the input variable to output
variable
o Give the dummy variable a name click change
o Under old and new values, it tis possible to indicate which
group should get which value for the dummy variable
o Under old value, indicate which value the group had on the
old variable, and under new value, indicate that this should be
1 click on add
o Under old value select system or user-missing and indicate
that under new value that these values must become missing
values on the new variable (system-missing). Click on add
o Then indicate onder old value that you want to recode all
other values and indicate under new value that they all get the
value 0. Click on add
o Click continue and then OK you have your dummy
variable in your data file
Formula:
, Assumptions:
o Independent observations
o Dependent variable should be continuous (interval or ratio)
o Independent variable should be continuous or dichotomous
(nominal with two categories)
Predictor can be changed into several dichotomous variables
(dummy’s).
o Linear relationship between predictors and dependent variable.
o Absence of outliers (in X, Y and XY-space)
o Absence of multicollinearity
o Homoscedasticity
o Normality distributed residuals
: the effect on predictor X1 on outcome Y is
different for different levels of a second predictor X2
(for example. when X2 is gender)
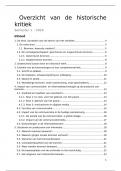
Regression equation:
Ŷ = b0 + b1×X1 + b2×gender
+ b3×X1×gender
SPSS: PROCESS choose model number
1 use options for centering and for getting
syntax that gives you the “mean +/- 1SD
plots”
o Centering: subtracting the mean
from each individual score, yielding an new variable, with a
mean of zero and the same variance as the original variable.
Makes the regression coefficients meaningful and
solves multicollinearity
SPSS:
Go to ‘transform’ compute variable
Provide a name for the new variable under
Target variable
Under numeric expression, define how the
new variable should be computed
Drag the variable you want to center from the
column on the left to the text box
Subsequently type “-mean”
(USE A DOT AS A DECIMAL SIGN.)
Click OK
o How to make an interaction term in SPSS:
Transform compute variable
Provide a name for the new variable under target
variable
Under Numerix Expression, define how the
interaction term should be computed:
Drag the centered variable from the column
on the left to the test box
Subsequently type “*”