Oneway
Notes
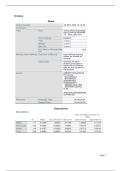
Output Created 30-DEC-2025 14:16:50
Comments
Input Data /Users/rebeccavanwinge
rden/Desktop/8526849
79---Data_geur.sav
Active Dataset DataSet1
Filter <none>
Weight <none>
Split File <none>
N of Rows in Working Data 324
File
Missing Value Handling Definition of Missing User-defined missing
values are treated as
missing.
Cases Used Statistics for each
analysis are based on
cases with no missing
data for any variable in
the analysis.
Syntax ONEWAY Menselijkheid
BY Uiterlijk
/ES=OVERALL
/STATISTICS
DESCRIPTIVES
HOMOGENEITY
/MISSING ANALYSIS
/CRITERIA=CILEVEL
(0.95)
/POSTHOC=BONFERRONI
ALPHA(0.05).
Resources Processor Time 00:00:00,01
Elapsed Time 00:00:00,00
Descriptives
Menselijkheid
95% Confidence Interval for
Mean
N Mean Std. Deviation Std. Error Lower Bound Upper Bound
Robot 111 2.0180 .82000 .07783 1.8638 2.1723 1.00
Mens (foto) 103 5.0388 1.08395 .10680 4.8270 5.2507 3.00
Avatar 110 3.8727 1.03258 .09845 3.6776 4.0679 2.00
Total 324 3.6080 1.58282 .08793 3.4350 3.7810 1.00
Page 1
, Descriptives
Menselijkheid
Minimum Maximum
Robot 1.00 4.00
Mens (foto) 3.00 8.00
Avatar 2.00 7.00
Total 1.00 8.00
Tests of Homogeneity of Variances
Levene Statistic df1 df2 Sig.
Menselijkheid Based on Mean 8.037 2 321 <.001
Based on Median 7.089 2 321 <.001
Based on Median and with 7.089 2 318.665 <.001
adjusted df
Based on trimmed mean 7.552 2 321 <.001
ANOVA
Menselijkheid
Sum of Squares df Mean Square F Sig.
Between Groups 499.192 2 249.596 258.430 <.001
Within Groups 310.027 321 .966
Total 809.219 323
ANOVA Effect Sizesa
95% Confidence Interval
Point Estimate Lower Upper
Menselijkheid Eta-squared .617 .554 .665
Epsilon-squared .614 .551 .662
Omega-squared Fixed- .614 .551 .662
effect
Omega-squared Random- .443 .380 .495
effect
a. Eta-squared and Epsilon-squared are estimated based on the fixed-effect
model.
Post Hoc Tests
Page 2
Notes
Output Created 30-DEC-2025 14:16:50
Comments
Input Data /Users/rebeccavanwinge
rden/Desktop/8526849
79---Data_geur.sav
Active Dataset DataSet1
Filter <none>
Weight <none>
Split File <none>
N of Rows in Working Data 324
File
Missing Value Handling Definition of Missing User-defined missing
values are treated as
missing.
Cases Used Statistics for each
analysis are based on
cases with no missing
data for any variable in
the analysis.
Syntax ONEWAY Menselijkheid
BY Uiterlijk
/ES=OVERALL
/STATISTICS
DESCRIPTIVES
HOMOGENEITY
/MISSING ANALYSIS
/CRITERIA=CILEVEL
(0.95)
/POSTHOC=BONFERRONI
ALPHA(0.05).
Resources Processor Time 00:00:00,01
Elapsed Time 00:00:00,00
Descriptives
Menselijkheid
95% Confidence Interval for
Mean
N Mean Std. Deviation Std. Error Lower Bound Upper Bound
Robot 111 2.0180 .82000 .07783 1.8638 2.1723 1.00
Mens (foto) 103 5.0388 1.08395 .10680 4.8270 5.2507 3.00
Avatar 110 3.8727 1.03258 .09845 3.6776 4.0679 2.00
Total 324 3.6080 1.58282 .08793 3.4350 3.7810 1.00
Page 1
, Descriptives
Menselijkheid
Minimum Maximum
Robot 1.00 4.00
Mens (foto) 3.00 8.00
Avatar 2.00 7.00
Total 1.00 8.00
Tests of Homogeneity of Variances
Levene Statistic df1 df2 Sig.
Menselijkheid Based on Mean 8.037 2 321 <.001
Based on Median 7.089 2 321 <.001
Based on Median and with 7.089 2 318.665 <.001
adjusted df
Based on trimmed mean 7.552 2 321 <.001
ANOVA
Menselijkheid
Sum of Squares df Mean Square F Sig.
Between Groups 499.192 2 249.596 258.430 <.001
Within Groups 310.027 321 .966
Total 809.219 323
ANOVA Effect Sizesa
95% Confidence Interval
Point Estimate Lower Upper
Menselijkheid Eta-squared .617 .554 .665
Epsilon-squared .614 .551 .662
Omega-squared Fixed- .614 .551 .662
effect
Omega-squared Random- .443 .380 .495
effect
a. Eta-squared and Epsilon-squared are estimated based on the fixed-effect
model.
Post Hoc Tests
Page 2