Lab 1 Introduction to Science BIO101L
Student Name:
Access Code (located on the lid of your lab kit):
Lab Report Format Expectations
Utilize college level grammar and professional formatting when completing this worksheet.
EXERCISE 1: WATER QUALITY VS. FISH POPULATION
Introduction Questions
Dissolved oxygen is oxygen that is trapped in a fluid, such as water. Since many living organisms
require oxygen to survive, it is a necessary component of water systems such as streams, lakes
and rivers in order to support aquatic life. The dissolved oxygen is measured in units of ppm
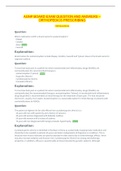
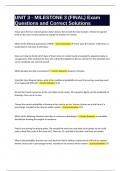
(parts per million). Examine the data in Table 4 showing the amount of dissolved oxygen present
and the number of fish observed in the body of water the sample was taken from; finally,
answer the questions below.
Table 4: Water Quality vs. Fish Population
1 1 1 1 1
Dissolved Oxygen (ppm) 0 2 4 6 8
0 2 4 6 8
Number of Fish 1 1 1 1 1 1 1
Observed
0 1 3
0 2 3 5 0 2 3
1. What is the question being studied in the experiment presented above?
The experiment asks whether the level of dissolved oxygen in water affects the number of fish
observed.
2. Develop a hypothesis relating to the amount of dissolved oxygen measured in the water sample
and the number of fish observed in the body of water.
If the dissolved oxygen in the water increases, then the number of fish observed will also
increase up to an optimal level, after which the effect may level off or decline.
3. What would your experimental approach be to test this hypothesis?
I would set up multiple water tanks or select several natural bodies of water with different
controlled dissolved oxygen levels while keeping other factors (temperature, pH, food supply,
etc.) constant. Then I would count the fish in each environment over the same period.
,Lab 1 Introduction to Science BIO101L
, Lab 1 Introduction to Science BIO101L
4. What would be the independent and dependent variables?
Independent Variable: The amount of dissolved oxygen (ppm) in the water.
Dependent Variable: The number of fish observed
5. What kind of controls would you need?
Controls would include keeping other water quality factors constant—such as temperature, pH,
water flow, and food supply—to ensure that any change in fish population is due solely to
differences in dissolved oxygen.
Data and Observations
1. What patterns do you observe based on the information in Table 4?
The number of fish generally increases as the dissolved oxygen rises, peaking around 12 ppm.
After that, the numbers seem to level off or slightly decline, suggesting there is an optimal range.
2. What type of graph would be appropriate for this data set? Why?
A scatter plot with a line of best fit would be appropriate because it clearly shows the
relationship between dissolved oxygen levels and the number of fish, allowing us to see trends
or an optimum level.
Student Name:
Access Code (located on the lid of your lab kit):
Lab Report Format Expectations
Utilize college level grammar and professional formatting when completing this worksheet.
EXERCISE 1: WATER QUALITY VS. FISH POPULATION
Introduction Questions
Dissolved oxygen is oxygen that is trapped in a fluid, such as water. Since many living organisms
require oxygen to survive, it is a necessary component of water systems such as streams, lakes
and rivers in order to support aquatic life. The dissolved oxygen is measured in units of ppm
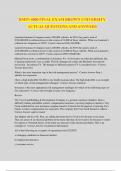
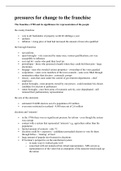
(parts per million). Examine the data in Table 4 showing the amount of dissolved oxygen present
and the number of fish observed in the body of water the sample was taken from; finally,
answer the questions below.
Table 4: Water Quality vs. Fish Population
1 1 1 1 1
Dissolved Oxygen (ppm) 0 2 4 6 8
0 2 4 6 8
Number of Fish 1 1 1 1 1 1 1
Observed
0 1 3
0 2 3 5 0 2 3
1. What is the question being studied in the experiment presented above?
The experiment asks whether the level of dissolved oxygen in water affects the number of fish
observed.
2. Develop a hypothesis relating to the amount of dissolved oxygen measured in the water sample
and the number of fish observed in the body of water.
If the dissolved oxygen in the water increases, then the number of fish observed will also
increase up to an optimal level, after which the effect may level off or decline.
3. What would your experimental approach be to test this hypothesis?
I would set up multiple water tanks or select several natural bodies of water with different
controlled dissolved oxygen levels while keeping other factors (temperature, pH, food supply,
etc.) constant. Then I would count the fish in each environment over the same period.
,Lab 1 Introduction to Science BIO101L
, Lab 1 Introduction to Science BIO101L
4. What would be the independent and dependent variables?
Independent Variable: The amount of dissolved oxygen (ppm) in the water.
Dependent Variable: The number of fish observed
5. What kind of controls would you need?
Controls would include keeping other water quality factors constant—such as temperature, pH,
water flow, and food supply—to ensure that any change in fish population is due solely to
differences in dissolved oxygen.
Data and Observations
1. What patterns do you observe based on the information in Table 4?
The number of fish generally increases as the dissolved oxygen rises, peaking around 12 ppm.
After that, the numbers seem to level off or slightly decline, suggesting there is an optimal range.
2. What type of graph would be appropriate for this data set? Why?
A scatter plot with a line of best fit would be appropriate because it clearly shows the
relationship between dissolved oxygen levels and the number of fish, allowing us to see trends
or an optimum level.