Covers All 12 Chapters
SOLUTIONS MANUAL
, Contents
1 What Is R? 1
2 Exploring Data 27
3 General Probability and Random Variables 79
4 Univariate Probability Distributions 121
5 Multivariate Probability Distributions 171
6 Sampling and Sampling Distributions 209
7 Point Estimation 245
8 Confidence Intervals 307
9 Hypothesis Testing 345
10 Nonparametric Methods 429
11 Experimental Design 477
12 Regression 541
Bibliography 661
Index 671
v
@@
Se
Siesm iciisco
ism isloaltaiotinon
K14521_SM-Color_Cover.indd 5 30/06/1
,K14521_SM-Color_Cover.indd 7 30/06/1
, Chapter 1
What Is R?
1. Calculate the following numerical results to three decimal places with R:
(a) (7 − 8) + 5 3 − 5 ÷ 6 + √62
√
(b) ln 3 + 2 sin(π) − e3
√
(c) 2 × (5 + 3) − 6 + 92
3
(d) ln(5) − exp(2) + 2
√
(e) (9 ÷ 2) × 4 − 10 + ln(6) − exp(1)
Solution:
(a) 131.041
> round((7 - 8) + 5^3 - 5/6 + sqrt(62), 3)
[1] 131.041
(b) -18.987
> round(log(3) - sqrt(2) * sin(pi) - exp(3), 3)
[1] -18.987
(c) 94.551
> round(2 * (5 + 3) - sqrt(6) + 9^2, 3)
[1] 94.551
(d) 2.22
> round(log(5) - exp(2) + 2^3, 3)
[1] 2.22
(e) 13.911
> round(9/2 * 4 - sqrt(10) + log(6) - exp(1), 3)
[1] 13.911
2. Create a vector named countby5that is a sequence of 5 to 100 in steps
of 5. Solution:
1
@@
Se
Siesimiciicsiosloaltaiotinon
sm
K14521_SM-Color_Cover.indd 7 30/06/1
, 2 Probability and Statistics with R, Second Edition: Exercises and Solutions
> countby5 <- seq(from = 5, to = 100, by = 5)
> countby5
[1] 5 10 15 20 25 30 35 40 45 50 55 60 65 70 75 80 85
[18] 90 95 100
3. Create a vector named Treatment with the entries “Treatment One” appearing 20 times,
“Treatment Two” appearing 18 times, and “Treatment Three” appearing 22 times.
Solution:
> Treatment <- rep(c("Treatment One", "Treatment Two", "Treatment Three"),
+ c(20, 18, 22))
> xtabs(~Treatment)
Treatment
Treatment One Treatment Three Treatment
Two 20 22 18
4. Provide the missing values in rep(seq( , , ), ) to create the sequence 20, 15,
15, 10, 10, 10, 5, 5, 5, 5.
Solution:
> rep(seq(from = 20, to = 5, by = -5), times = 1:4)
[1] 20 15 15 10 10 10 5 5 5 5
5. Vectors, sequences, and logical operators
(a) Assign the names x and y to the values 5 and 7, respectively. Find xy and assign the
result to z. What is the valued stored in z?
(b) Create the vectors u = (1, 2, 5, 4) and v = (2, 2, 1, 1) using the c() function.
(c) Provide R code to find which component of u is equal to 5.
(d) Provide R code to give the components of v greater than or equal to 2.
(e) Find the product u × v. How does R perform the operation?
(f) Explain what R does when two vectors of unequal length are multiplied together.
Specifically, what is u × c(u, v)?
(g) Provide R code to define a sequence from 1 to 10 called G and subsequently to select
the first three components of G.
(h) Use R to define a sequence from 1 to 30 named J with an increment of 2 and subsequently to
choose the first, third, and eighth values of J.
(i) Calculate the scalar product (dot product) of q = (3, 0, 1, 6) by r = (1, 0, 2, 4).
@@
Se
Siesm iciisco
ism isloaltaiotinon
K14521_SM-Color_Cover.indd 8 30/06/1
, Chapter 1: What Is R? 3
(j) Define the matrix X whose rows are the uand vvectors from part (b).
(k) Define the matrix Y whose columns are the uand vvectors from part (b).
(l) Find the matrix product of X by Y and name it W.
(m) Provide Rcode thatcomputes the inversematrixofWandthetranspose ofthatinverse.
Solution:
(a) The valued stored in zis 78125.
> x <- 5
> y <- 7
> z <- x^y
> z
[1] 78125
(b)
> u <- c(1, 2, 5, 4)
> v <- c(2, 2, 1, 1)
(c)
> which(u == 5)
[1] 3
(d)
> which(v >= 2)
[1] 1 2
(e) Multiplication of vectors with Ris element by element.
> uv <- u * v
> uv
[1] 2 4 5 4
(f) The values in the shorter vector are recycled until the two vectors are the same size. In this
case, u*c(u, v)is the same as c(u, u)*c(u, v).
> u * (c(u, v))
[1] 1 4 25 16 2 4 5 4
> c(u, u) * c(u, v)
[1] 1 4 25 16 2 4 5 4
(g)
@@
Se
Siesm iciisco
ism isloaltaiotinon
K14521_SM-Color_Cover.indd 9 30/06/1
, 4 Probability and Statistics with R, Second Edition: Exercises and Solutions
> G <- 1:10
> G[1:3]
[1] 1 2 3
(h)
> J <- seq(from = 1, to = 30, by = 2)
> J[c(1, 3, 8)]
[1] 1 5 15
(i)
> q <- c(3, 0, 1, 6)
> r <- c(1, 0, 2, 4)
> q %*% r
[,1]
[1,] 29
(j)
> X <- rbind(u, v)
> X
[,1] [,2] [,3] [,4]
u 1 2 5 4
v 2 2 1 1
(k)
> Y <- cbind(u, v)
> Y
u v
[1,] 1 2
[2,] 2 2
[3,] 5 1
[4,] 4 1
(l)
> W <- X %*% Y
> W
u v
u 46 15
v 15 10
(m)
> solve(W)
u v
u 0.04255319 -0.06382979
v -0.06382979 0.19574468
@@
Se
Siesimiciicsiosloaltaiotinon
sm
K14521_SM-Color_Cover.indd 10 30/06/1
, Chapter 1: What Is R? 5
> t(solve(W))
u v
u 0.04255319 -0.06382979
v -0.06382979 0.19574468
6. How many of the apartments in the VIT2005 data frame, part of the PASWR2 package, have a
totalprice greater than e 400,000 and also have a garage? Use a single line of R code to
determine the answer.
Solution:
There are 6 apartments with a totalprice greater than e400,000 that also have a garage.
> dim(VIT2005[VIT2005$totalprice >=400000 & VIT2005$garage >=1, ])[1]
[1] 6
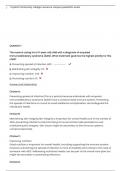
7. Wheat harvested surface in Spain in 2004: Figure 1.1, made with R, depicts the
autonomous communities in Spain. The Wheat Table that follows gives the wheat harvested surfaces
in 2004 by autonomous communities in Spain measured in hectares. Provide R code to answer all the
questions.
Asturias Cantabria
Pais Vasco
Galicia Navarra
Rioja
Castilla−Leon Cataluna
Aragon
Madrid
Castilla−la Mancha Baleares
Communidad Valenciana
Extremadura
Murci
a
Andalucia
Canarias
FIGURE 1.1: Autonomous communities in Spain
@@
Se
Siesimiciicsiosloaltaiotinon
sm
K14521_SM-Color_Cover.indd 11 30/06/1
, 6 Probability and Statistics with R, Second Edition: Exercises and Solutions
Wheat Table
community wheat.surface community wheat.surface
Galicia 18817 Castilla y León 619858
Asturias 65 Madrid 13118
Cantabria 440 Castilla-La Mancha 263424
Paı́s Vasco 25143 C. Valenciana 6111
Navarra 66326 Región de Murcia 9500
La Rioja 34214 Extremadura 143250
Aragón 311479 Andalucı́a 558292
Cataluña 74206 Islas Canarias 100
Islas Baleares 7203
(a) Create the variables community and wheat.surface from the Wheat Table in this
problem. Store both variables in a data.frame named wheatspain.
(b) Find the maximum, the minimum, and the range for the variable wheat.surface.
(c) Which community has the largest harvested wheat surface?
(d) Sort the autonomous communities by harvested surface in ascending order.
(e) Sort the autonomous communities by harvested surfaces in descending order. (f)
Create a new file called wheat.cwhere Asturiashas been removed.
(g) Add Asturias back to the file wheat.c.
(h) Create in wheat.ca new variable called acreindicating the harvested surface in acres (1
acre = 0.40468564224 hectares).
(i) What is the total harvested surface in hectares and in acres in Spain in 2004?
(j) Define in wheat.cthe row.names()using the names of the communities. Remove the
community variable from wheat.c.
(k) What percent of the autonomous communities have a harvested wheat surface greater
than the mean wheat surface area?
(l) Sort wheat.cby autonomous communities’ names (row.names()).
(m) Determine the communities with less than 40,000 acres of harvested surface and find
their total harvested surface in hectares and acres.
(n) Create a new file called wheat.sum where the autonomous communities that have less
than 40,000 acres of harvested surface are consolidated into a single category named
“less than 40,000” with the results from (m).
(o) Use the function dump()on wheat.c, storing the results in a new file named wheat.txt.
Remove wheat.cfrom your path and check that you can recover it from wheat.txt.
(p) Create a text file called wheat.dat from the wheat.sum file using the command
write.table(). Explain the differences between wheat.txtand wheat.dat.
(q) Use the command read.table() to read the file wheat.dat.
K14521_SM-Color_Cover.indd 12 30/06/1
, THOSE WERE PREVIEW PAGES
TO DOWNLOAD THE FULL PDF
CLICK ON THE L.I.N.K
ON THE NEXT PAGE
K14521_SM-Color_Cover.indd 12 30/06/1
SOLUTIONS MANUAL
, Contents
1 What Is R? 1
2 Exploring Data 27
3 General Probability and Random Variables 79
4 Univariate Probability Distributions 121
5 Multivariate Probability Distributions 171
6 Sampling and Sampling Distributions 209
7 Point Estimation 245
8 Confidence Intervals 307
9 Hypothesis Testing 345
10 Nonparametric Methods 429
11 Experimental Design 477
12 Regression 541
Bibliography 661
Index 671
v
@@
Se
Siesm iciisco
ism isloaltaiotinon
K14521_SM-Color_Cover.indd 5 30/06/1
,K14521_SM-Color_Cover.indd 7 30/06/1
, Chapter 1
What Is R?
1. Calculate the following numerical results to three decimal places with R:
(a) (7 − 8) + 5 3 − 5 ÷ 6 + √62
√
(b) ln 3 + 2 sin(π) − e3
√
(c) 2 × (5 + 3) − 6 + 92
3
(d) ln(5) − exp(2) + 2
√
(e) (9 ÷ 2) × 4 − 10 + ln(6) − exp(1)
Solution:
(a) 131.041
> round((7 - 8) + 5^3 - 5/6 + sqrt(62), 3)
[1] 131.041
(b) -18.987
> round(log(3) - sqrt(2) * sin(pi) - exp(3), 3)
[1] -18.987
(c) 94.551
> round(2 * (5 + 3) - sqrt(6) + 9^2, 3)
[1] 94.551
(d) 2.22
> round(log(5) - exp(2) + 2^3, 3)
[1] 2.22
(e) 13.911
> round(9/2 * 4 - sqrt(10) + log(6) - exp(1), 3)
[1] 13.911
2. Create a vector named countby5that is a sequence of 5 to 100 in steps
of 5. Solution:
1
@@
Se
Siesimiciicsiosloaltaiotinon
sm
K14521_SM-Color_Cover.indd 7 30/06/1
, 2 Probability and Statistics with R, Second Edition: Exercises and Solutions
> countby5 <- seq(from = 5, to = 100, by = 5)
> countby5
[1] 5 10 15 20 25 30 35 40 45 50 55 60 65 70 75 80 85
[18] 90 95 100
3. Create a vector named Treatment with the entries “Treatment One” appearing 20 times,
“Treatment Two” appearing 18 times, and “Treatment Three” appearing 22 times.
Solution:
> Treatment <- rep(c("Treatment One", "Treatment Two", "Treatment Three"),
+ c(20, 18, 22))
> xtabs(~Treatment)
Treatment
Treatment One Treatment Three Treatment
Two 20 22 18
4. Provide the missing values in rep(seq( , , ), ) to create the sequence 20, 15,
15, 10, 10, 10, 5, 5, 5, 5.
Solution:
> rep(seq(from = 20, to = 5, by = -5), times = 1:4)
[1] 20 15 15 10 10 10 5 5 5 5
5. Vectors, sequences, and logical operators
(a) Assign the names x and y to the values 5 and 7, respectively. Find xy and assign the
result to z. What is the valued stored in z?
(b) Create the vectors u = (1, 2, 5, 4) and v = (2, 2, 1, 1) using the c() function.
(c) Provide R code to find which component of u is equal to 5.
(d) Provide R code to give the components of v greater than or equal to 2.
(e) Find the product u × v. How does R perform the operation?
(f) Explain what R does when two vectors of unequal length are multiplied together.
Specifically, what is u × c(u, v)?
(g) Provide R code to define a sequence from 1 to 10 called G and subsequently to select
the first three components of G.
(h) Use R to define a sequence from 1 to 30 named J with an increment of 2 and subsequently to
choose the first, third, and eighth values of J.
(i) Calculate the scalar product (dot product) of q = (3, 0, 1, 6) by r = (1, 0, 2, 4).
@@
Se
Siesm iciisco
ism isloaltaiotinon
K14521_SM-Color_Cover.indd 8 30/06/1
, Chapter 1: What Is R? 3
(j) Define the matrix X whose rows are the uand vvectors from part (b).
(k) Define the matrix Y whose columns are the uand vvectors from part (b).
(l) Find the matrix product of X by Y and name it W.
(m) Provide Rcode thatcomputes the inversematrixofWandthetranspose ofthatinverse.
Solution:
(a) The valued stored in zis 78125.
> x <- 5
> y <- 7
> z <- x^y
> z
[1] 78125
(b)
> u <- c(1, 2, 5, 4)
> v <- c(2, 2, 1, 1)
(c)
> which(u == 5)
[1] 3
(d)
> which(v >= 2)
[1] 1 2
(e) Multiplication of vectors with Ris element by element.
> uv <- u * v
> uv
[1] 2 4 5 4
(f) The values in the shorter vector are recycled until the two vectors are the same size. In this
case, u*c(u, v)is the same as c(u, u)*c(u, v).
> u * (c(u, v))
[1] 1 4 25 16 2 4 5 4
> c(u, u) * c(u, v)
[1] 1 4 25 16 2 4 5 4
(g)
@@
Se
Siesm iciisco
ism isloaltaiotinon
K14521_SM-Color_Cover.indd 9 30/06/1
, 4 Probability and Statistics with R, Second Edition: Exercises and Solutions
> G <- 1:10
> G[1:3]
[1] 1 2 3
(h)
> J <- seq(from = 1, to = 30, by = 2)
> J[c(1, 3, 8)]
[1] 1 5 15
(i)
> q <- c(3, 0, 1, 6)
> r <- c(1, 0, 2, 4)
> q %*% r
[,1]
[1,] 29
(j)
> X <- rbind(u, v)
> X
[,1] [,2] [,3] [,4]
u 1 2 5 4
v 2 2 1 1
(k)
> Y <- cbind(u, v)
> Y
u v
[1,] 1 2
[2,] 2 2
[3,] 5 1
[4,] 4 1
(l)
> W <- X %*% Y
> W
u v
u 46 15
v 15 10
(m)
> solve(W)
u v
u 0.04255319 -0.06382979
v -0.06382979 0.19574468
@@
Se
Siesimiciicsiosloaltaiotinon
sm
K14521_SM-Color_Cover.indd 10 30/06/1
, Chapter 1: What Is R? 5
> t(solve(W))
u v
u 0.04255319 -0.06382979
v -0.06382979 0.19574468
6. How many of the apartments in the VIT2005 data frame, part of the PASWR2 package, have a
totalprice greater than e 400,000 and also have a garage? Use a single line of R code to
determine the answer.
Solution:
There are 6 apartments with a totalprice greater than e400,000 that also have a garage.
> dim(VIT2005[VIT2005$totalprice >=400000 & VIT2005$garage >=1, ])[1]
[1] 6
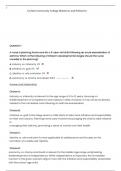
7. Wheat harvested surface in Spain in 2004: Figure 1.1, made with R, depicts the
autonomous communities in Spain. The Wheat Table that follows gives the wheat harvested surfaces
in 2004 by autonomous communities in Spain measured in hectares. Provide R code to answer all the
questions.
Asturias Cantabria
Pais Vasco
Galicia Navarra
Rioja
Castilla−Leon Cataluna
Aragon
Madrid
Castilla−la Mancha Baleares
Communidad Valenciana
Extremadura
Murci
a
Andalucia
Canarias
FIGURE 1.1: Autonomous communities in Spain
@@
Se
Siesimiciicsiosloaltaiotinon
sm
K14521_SM-Color_Cover.indd 11 30/06/1
, 6 Probability and Statistics with R, Second Edition: Exercises and Solutions
Wheat Table
community wheat.surface community wheat.surface
Galicia 18817 Castilla y León 619858
Asturias 65 Madrid 13118
Cantabria 440 Castilla-La Mancha 263424
Paı́s Vasco 25143 C. Valenciana 6111
Navarra 66326 Región de Murcia 9500
La Rioja 34214 Extremadura 143250
Aragón 311479 Andalucı́a 558292
Cataluña 74206 Islas Canarias 100
Islas Baleares 7203
(a) Create the variables community and wheat.surface from the Wheat Table in this
problem. Store both variables in a data.frame named wheatspain.
(b) Find the maximum, the minimum, and the range for the variable wheat.surface.
(c) Which community has the largest harvested wheat surface?
(d) Sort the autonomous communities by harvested surface in ascending order.
(e) Sort the autonomous communities by harvested surfaces in descending order. (f)
Create a new file called wheat.cwhere Asturiashas been removed.
(g) Add Asturias back to the file wheat.c.
(h) Create in wheat.ca new variable called acreindicating the harvested surface in acres (1
acre = 0.40468564224 hectares).
(i) What is the total harvested surface in hectares and in acres in Spain in 2004?
(j) Define in wheat.cthe row.names()using the names of the communities. Remove the
community variable from wheat.c.
(k) What percent of the autonomous communities have a harvested wheat surface greater
than the mean wheat surface area?
(l) Sort wheat.cby autonomous communities’ names (row.names()).
(m) Determine the communities with less than 40,000 acres of harvested surface and find
their total harvested surface in hectares and acres.
(n) Create a new file called wheat.sum where the autonomous communities that have less
than 40,000 acres of harvested surface are consolidated into a single category named
“less than 40,000” with the results from (m).
(o) Use the function dump()on wheat.c, storing the results in a new file named wheat.txt.
Remove wheat.cfrom your path and check that you can recover it from wheat.txt.
(p) Create a text file called wheat.dat from the wheat.sum file using the command
write.table(). Explain the differences between wheat.txtand wheat.dat.
(q) Use the command read.table() to read the file wheat.dat.
K14521_SM-Color_Cover.indd 12 30/06/1
, THOSE WERE PREVIEW PAGES
TO DOWNLOAD THE FULL PDF
CLICK ON THE L.I.N.K
ON THE NEXT PAGE
K14521_SM-Color_Cover.indd 12 30/06/1