1
Grade 12
Mathematics Paper 2
PRELIMINARY Exam 2025
Recourses:
NSC PRELIMINARY: MATHEMATICS P2 | 2023. DBE/ PREPARATORY EXAMINATION 2024_ Gauteng.
DBE/ PREPARATORY EXAMINATION 2023_ Gauteng
Some information may be repeated deliberately to show different ways the same type of question can
be asked. You are encouraged to work through all calculations and diagrams. Use your textbook and
class notes together with this booklet.
For more Juffrou Ansie products contact
Good luck
Juffrou Ansie
Content
Statistics 2
NSC/ PREPARATORY EXAMINATION 2022 2
DBE/ PREPARATORY EXAMINATION 2024_ Gauteng 5
NSC PRELIMINARY: MATHEMATICS P2 | 2023 9
Analytical Geometry 10
NSC/ PREPARATORY EXAMINATION 2022 10
DBE/ PREPARATORY EXAMINATION 2024_ Gauteng 16
NSC PRELIMINARY: MATHEMATICS P2 | 2023 21
Trigonometry 26
NSC/ PREPARATORY EXAMINATION 2022 26
DBE/ PREPARATORY EXAMINATION 2024_ Gauteng 31
NSC PRELIMINARY: MATHEMATICS P2 | 2023 37
Euclidean Geometry 43
NSC/ PREPARATORY EXAMINATION 2022 43
@Juffrou_Ansie
, 2
DBE/ PREPARATORY EXAMINATION 2024_ Gauteng 49
NSC PRELIMINARY: MATHEMATICS P2 | 2023 54
Statistics
NSC/ PREPARATORY EXAMINATION 2022
QUESTION 1
Mrs Molefe decided to research the effectiveness of her online classes. She divided the
Grade 12 pupils fairly into Grade 12A and Grade 12B. Grade 12A attended face-to-face
classes and Grade 12B attended online classes. Both classes were taught by Mrs Molefe
for the same duration.
The table below shows the time spent teaching (in hours) and the average results achieved
by the learners in their weekly tests as percentages (%).
1.1 Determine the equation of the least squares regression line of Grade 12A.
1.2 Write down the correlation coefficient of the Grade 12A results in respect of the (1)
time spent teaching.
1.3 Comment on the correlation between the time spent teaching and the average (1)
result of Grade 12A.
1.4 The equation of the least squares regression line of Grade 12B is y = 15,74 + 4,54x. (3)
@Juffrou_Ansie
, 3
Calculate the difference in the result achieved by each class had Mrs Molefe spent
the average time to complete a particular section.
1.5 Identify an outlier in Grade 12B.
1.6 Indicate a valid reason for this outlier.
_____________________________________________________________
@Juffrou_Ansie
, 4
QUESTION 2
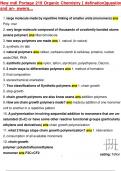
Formula 1 (F1) race car drivers must endure
high G-forces at extremely high
temperatures.
They tend to lose close to 4 kg of weight after
every race.
2.1
The table below shows the total weight lost by 40 different race car drivers after the
duration of one race.
2.1.1 Write down the modal class of the data. (1)
2.1.2 Calculate the estimated mean weight-loss of the race car drivers. (3)
2.2
@Juffrou_Ansie
Grade 12
Mathematics Paper 2
PRELIMINARY Exam 2025
Recourses:
NSC PRELIMINARY: MATHEMATICS P2 | 2023. DBE/ PREPARATORY EXAMINATION 2024_ Gauteng.
DBE/ PREPARATORY EXAMINATION 2023_ Gauteng
Some information may be repeated deliberately to show different ways the same type of question can
be asked. You are encouraged to work through all calculations and diagrams. Use your textbook and
class notes together with this booklet.
For more Juffrou Ansie products contact
Good luck
Juffrou Ansie
Content
Statistics 2
NSC/ PREPARATORY EXAMINATION 2022 2
DBE/ PREPARATORY EXAMINATION 2024_ Gauteng 5
NSC PRELIMINARY: MATHEMATICS P2 | 2023 9
Analytical Geometry 10
NSC/ PREPARATORY EXAMINATION 2022 10
DBE/ PREPARATORY EXAMINATION 2024_ Gauteng 16
NSC PRELIMINARY: MATHEMATICS P2 | 2023 21
Trigonometry 26
NSC/ PREPARATORY EXAMINATION 2022 26
DBE/ PREPARATORY EXAMINATION 2024_ Gauteng 31
NSC PRELIMINARY: MATHEMATICS P2 | 2023 37
Euclidean Geometry 43
NSC/ PREPARATORY EXAMINATION 2022 43
@Juffrou_Ansie
, 2
DBE/ PREPARATORY EXAMINATION 2024_ Gauteng 49
NSC PRELIMINARY: MATHEMATICS P2 | 2023 54
Statistics
NSC/ PREPARATORY EXAMINATION 2022
QUESTION 1
Mrs Molefe decided to research the effectiveness of her online classes. She divided the
Grade 12 pupils fairly into Grade 12A and Grade 12B. Grade 12A attended face-to-face
classes and Grade 12B attended online classes. Both classes were taught by Mrs Molefe
for the same duration.
The table below shows the time spent teaching (in hours) and the average results achieved
by the learners in their weekly tests as percentages (%).
1.1 Determine the equation of the least squares regression line of Grade 12A.
1.2 Write down the correlation coefficient of the Grade 12A results in respect of the (1)
time spent teaching.
1.3 Comment on the correlation between the time spent teaching and the average (1)
result of Grade 12A.
1.4 The equation of the least squares regression line of Grade 12B is y = 15,74 + 4,54x. (3)
@Juffrou_Ansie
, 3
Calculate the difference in the result achieved by each class had Mrs Molefe spent
the average time to complete a particular section.
1.5 Identify an outlier in Grade 12B.
1.6 Indicate a valid reason for this outlier.
_____________________________________________________________
@Juffrou_Ansie
, 4
QUESTION 2
Formula 1 (F1) race car drivers must endure
high G-forces at extremely high
temperatures.
They tend to lose close to 4 kg of weight after
every race.
2.1
The table below shows the total weight lost by 40 different race car drivers after the
duration of one race.
2.1.1 Write down the modal class of the data. (1)
2.1.2 Calculate the estimated mean weight-loss of the race car drivers. (3)
2.2
@Juffrou_Ansie