Briefing Document: Statistical Concepts and Analyses from
Provided Sources
This briefing document summarizes the main themes and important ideas
presented across the provided excerpts from "MRM2.pdf" and various "PC
Lab" assignments and answer keys. The document covers fundamental
statistical concepts, different types of analyses (ANOVA, Regression,
Logistic Regression, Factor Analysis, Reliability Analysis), and their
interpretation, often with practical examples from the lab assignments.
I. Fundamental Statistical Concepts
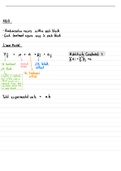
P-value and Hypothesis Testing: A cutoff p-value of .05 (5%) is
used to determine statistical significance. "a p- value<.05 means we
can reject H0." (MRM2.pdf - Week 1).
Null Hypothesis (H₀): Typically states no effect or no difference.
Examples include: "H₀: Cause has nothing to do with effect"
(MRM2.pdf - Conceptual model) and in ANOVA, "H0: μ1 = μ2 = ⋯ =
μ𝑖" ("There is no difference in mean across the different categories" -
MRM2.pdf - ANOVA Table). In regression, the null hypothesis for
individual PVs is often "H0: βpv = 0" (PC lab 5 - Open Book
Assignment - answers-1 (1).pdf).
Alternative Hypothesis (H₁ or HA): States there is an effect or a
difference. For example, in ANOVA, "𝐻1: 𝜇 ≠ 𝜇𝑗" ("There is a
difference in the means." - MRM2.pdf - ANOVA Table).
Measurement Scales: Variables can be categorical (nominal,
ordinal) or quantitative (discrete, interval, ratio). Ordinal scales like
Likert scales are sometimes treated as pseudo-interval in social
sciences (MRM2.pdf - Conceptual model).
Comparing Means and Standard Deviations: When comparing
groups, means indicate central tendency, and standard deviations
measure the spread of scores within each group. "Larger differences
in means suggest potential variability in the outcome variable...
based on the predictor variable..." (MRM2.pdf - How to Interpret).
Smaller standard deviations indicate more consistency within a
group.
Variance: Measures the spread of data. ANOVA tests for differences
in means by analyzing variance. Levene's test checks for the
equality of variances assumption in ANOVA. A p ≤ 0.05 in Levene's
test indicates unequal variances, violating the ANOVA assumption
(MRM2.pdf - difference in variances).
, Degrees of Freedom (df): Reflect the number of independent
pieces of information available to estimate a parameter (MRM2.pdf -
ANOVA Table).
II. Analysis of Variance (ANOVA)
Purpose: To investigate if the group means of an outcome variable
differ across different categories of a predictor variable(s).
ANOVA Table: Summarizes the sources of variance (Between
Groups/Model, Within Groups/Residual, Total), Sum of Squares (SS),
Degrees of Freedom (df), Mean Square (MS), F-ratio, and p-value
(MRM2.pdf - ANOVA Table).
F-ratio: "𝐹(𝑟𝑎𝑡𝑖𝑜) = 𝑒𝑥𝑝𝑙𝑎𝑖𝑛𝑒𝑑 𝑣𝑎𝑟𝑖𝑎𝑏𝑖𝑙𝑖𝑡 / 𝑢𝑛𝑒𝑥𝑝𝑙𝑎𝑖𝑛𝑒𝑑 𝑣𝑎𝑟𝑖𝑎𝑏𝑖𝑙𝑖𝑡 = 𝑏𝑒𝑡𝑤𝑒𝑒𝑛
𝑔𝑟𝑜𝑢𝑝 𝑣𝑎𝑟𝑖𝑎𝑏𝑖𝑙𝑖𝑡 / 𝑤𝑖𝑡ℎ𝑖𝑛 𝑔𝑟𝑜𝑢𝑝 𝑣𝑎𝑟𝑖𝑎𝑏𝑖𝑙𝑖𝑡 = ( 𝑆𝑆𝑀𝑜𝑑𝑒 / 𝑑𝑓𝑀𝑜𝑑𝑒 ) / (
𝑆𝑆𝑅𝑒𝑠𝑖𝑑𝑢𝑎 / 𝑑𝑓𝑅𝑒𝑠𝑖𝑑𝑢𝑎 ) = 𝑀𝑒𝑎𝑛𝑆𝑞𝑢𝑎𝑟𝑒𝑀𝑜𝑑𝑒 / 𝑀𝑒𝑎𝑛 𝑆𝑞𝑢𝑎𝑟𝑒𝑅𝑒𝑠𝑖𝑑𝑢𝑎"
(MRM2.pdf - ANOVA Table). A significant F-test (p < 0.05) indicates
that at least one group mean is different.
Post-Hoc Tests: Used after a significant ANOVA to determine which
specific group means differ from each other. Examples include
Bonferroni, Tukey, and LSD (MRM2.pdf - Post-Hoc Tests). These are
controlled to reduce Type I error. "In this case... you will see that
there is a difference between a) MBO and HBO (which is significant,
p-value of .026...)" (PC lab 1 - Open Book Assignment - answers-
1.pdf).
Effect Size (Partial Eta Squared - 𝜂²): Represents the proportion
of variance in the outcome variable explained by each predictor
variable or interaction effect. Thresholds: Small = 0.01, Medium =
0.06, Large = 0.14 (MRM2.pdf - Effect Size in Factorial ANOVA).
Factorial ANOVA: Examines the effects of two or more categorical
predictor variables (factors) and their interaction on a quantitative
outcome variable (MRM2.pdf - Factorial ANOVA). A significant
interaction indicates that the effect of one PV on the OV depends on
the level of the other PV. Interaction plots with non-parallel lines
visually suggest moderation (MRM2.pdf - Interpreting Moderation in
SPSS Outputs).
III. Regression Analysis
Purpose: To model the relationship between one or more predictor
variables (PVs) and a quantitative outcome variable (OV).
Simple Regression: One PV.
Provided Sources
This briefing document summarizes the main themes and important ideas
presented across the provided excerpts from "MRM2.pdf" and various "PC
Lab" assignments and answer keys. The document covers fundamental
statistical concepts, different types of analyses (ANOVA, Regression,
Logistic Regression, Factor Analysis, Reliability Analysis), and their
interpretation, often with practical examples from the lab assignments.
I. Fundamental Statistical Concepts
P-value and Hypothesis Testing: A cutoff p-value of .05 (5%) is
used to determine statistical significance. "a p- value<.05 means we
can reject H0." (MRM2.pdf - Week 1).
Null Hypothesis (H₀): Typically states no effect or no difference.
Examples include: "H₀: Cause has nothing to do with effect"
(MRM2.pdf - Conceptual model) and in ANOVA, "H0: μ1 = μ2 = ⋯ =
μ𝑖" ("There is no difference in mean across the different categories" -
MRM2.pdf - ANOVA Table). In regression, the null hypothesis for
individual PVs is often "H0: βpv = 0" (PC lab 5 - Open Book
Assignment - answers-1 (1).pdf).
Alternative Hypothesis (H₁ or HA): States there is an effect or a
difference. For example, in ANOVA, "𝐻1: 𝜇 ≠ 𝜇𝑗" ("There is a
difference in the means." - MRM2.pdf - ANOVA Table).
Measurement Scales: Variables can be categorical (nominal,
ordinal) or quantitative (discrete, interval, ratio). Ordinal scales like
Likert scales are sometimes treated as pseudo-interval in social
sciences (MRM2.pdf - Conceptual model).
Comparing Means and Standard Deviations: When comparing
groups, means indicate central tendency, and standard deviations
measure the spread of scores within each group. "Larger differences
in means suggest potential variability in the outcome variable...
based on the predictor variable..." (MRM2.pdf - How to Interpret).
Smaller standard deviations indicate more consistency within a
group.
Variance: Measures the spread of data. ANOVA tests for differences
in means by analyzing variance. Levene's test checks for the
equality of variances assumption in ANOVA. A p ≤ 0.05 in Levene's
test indicates unequal variances, violating the ANOVA assumption
(MRM2.pdf - difference in variances).
, Degrees of Freedom (df): Reflect the number of independent
pieces of information available to estimate a parameter (MRM2.pdf -
ANOVA Table).
II. Analysis of Variance (ANOVA)
Purpose: To investigate if the group means of an outcome variable
differ across different categories of a predictor variable(s).
ANOVA Table: Summarizes the sources of variance (Between
Groups/Model, Within Groups/Residual, Total), Sum of Squares (SS),
Degrees of Freedom (df), Mean Square (MS), F-ratio, and p-value
(MRM2.pdf - ANOVA Table).
F-ratio: "𝐹(𝑟𝑎𝑡𝑖𝑜) = 𝑒𝑥𝑝𝑙𝑎𝑖𝑛𝑒𝑑 𝑣𝑎𝑟𝑖𝑎𝑏𝑖𝑙𝑖𝑡 / 𝑢𝑛𝑒𝑥𝑝𝑙𝑎𝑖𝑛𝑒𝑑 𝑣𝑎𝑟𝑖𝑎𝑏𝑖𝑙𝑖𝑡 = 𝑏𝑒𝑡𝑤𝑒𝑒𝑛
𝑔𝑟𝑜𝑢𝑝 𝑣𝑎𝑟𝑖𝑎𝑏𝑖𝑙𝑖𝑡 / 𝑤𝑖𝑡ℎ𝑖𝑛 𝑔𝑟𝑜𝑢𝑝 𝑣𝑎𝑟𝑖𝑎𝑏𝑖𝑙𝑖𝑡 = ( 𝑆𝑆𝑀𝑜𝑑𝑒 / 𝑑𝑓𝑀𝑜𝑑𝑒 ) / (
𝑆𝑆𝑅𝑒𝑠𝑖𝑑𝑢𝑎 / 𝑑𝑓𝑅𝑒𝑠𝑖𝑑𝑢𝑎 ) = 𝑀𝑒𝑎𝑛𝑆𝑞𝑢𝑎𝑟𝑒𝑀𝑜𝑑𝑒 / 𝑀𝑒𝑎𝑛 𝑆𝑞𝑢𝑎𝑟𝑒𝑅𝑒𝑠𝑖𝑑𝑢𝑎"
(MRM2.pdf - ANOVA Table). A significant F-test (p < 0.05) indicates
that at least one group mean is different.
Post-Hoc Tests: Used after a significant ANOVA to determine which
specific group means differ from each other. Examples include
Bonferroni, Tukey, and LSD (MRM2.pdf - Post-Hoc Tests). These are
controlled to reduce Type I error. "In this case... you will see that
there is a difference between a) MBO and HBO (which is significant,
p-value of .026...)" (PC lab 1 - Open Book Assignment - answers-
1.pdf).
Effect Size (Partial Eta Squared - 𝜂²): Represents the proportion
of variance in the outcome variable explained by each predictor
variable or interaction effect. Thresholds: Small = 0.01, Medium =
0.06, Large = 0.14 (MRM2.pdf - Effect Size in Factorial ANOVA).
Factorial ANOVA: Examines the effects of two or more categorical
predictor variables (factors) and their interaction on a quantitative
outcome variable (MRM2.pdf - Factorial ANOVA). A significant
interaction indicates that the effect of one PV on the OV depends on
the level of the other PV. Interaction plots with non-parallel lines
visually suggest moderation (MRM2.pdf - Interpreting Moderation in
SPSS Outputs).
III. Regression Analysis
Purpose: To model the relationship between one or more predictor
variables (PVs) and a quantitative outcome variable (OV).
Simple Regression: One PV.