Effect Yoga/Fitness op Burnout
knitr::opts_chunk$set(width.cutoff = 50)
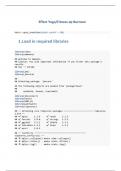
1. Load in required libraries
library(nlme)
library(emmeans)
## Welcome to emmeans.
## Caution: You lose important information if you filter this package's
results.
## See '? untidy'
library(jmv)
library(jmvcore)
##
## Attaching package: 'jmvcore'
## The following objects are masked from 'package:base':
##
## endsWith, format, startsWith
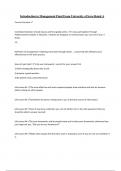
library(jmvconnect)
library(haven)
library(GAMLj3)
library(patchwork)
library(tidyverse)
## ── Attaching core tidyverse packages ──────────────────────── tidyverse
2.0.0 ──
## ✔ dplyr 1.1.4 ✔ readr 2.1.5
## ✔ forcats 1.0.0 ✔ stringr 1.5.1
## ✔ ggplot2 3.5.1 ✔ tibble 3.2.1
## ✔ lubridate 1.9.3 ✔ tidyr 1.3.1
## ✔ purrr 1.0.2
## ── Conflicts ──────────────────────────────────────────
tidyverse_conflicts() ──
## ✖ dplyr::collapse() masks nlme::collapse()
## ✖ dplyr::filter() masks stats::filter()
## ✖ dplyr::lag() masks stats::lag()
,## ✖ dplyr::select() masks jmvcore::select()
## ℹ Use the conflicted package (<http://conflicted.r-lib.org/>) to force
all conflicts to become errors
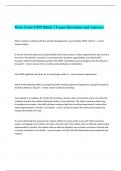
2. Read in the data
data <- read_sav("DATA251_vanMeegen_Browaeys.sav")
print(head(data))
## # A tibble: 6 × 7
## Respnum Vestiging Tijd Burnout Conditie Sekse Leeftijd
## <dbl> <dbl> <dbl> <dbl> <dbl+lbl> <dbl+lbl> <dbl>
## 1 108 29 4 3.59 2 [yoga] 0 [man] 37.0
## 2 34 8 3 2.95 1 [fitness] 0 [man] 30.8
## 3 31 23 2 3.80 1 [fitness] 0 [man] 43.3
## 4 151 5 1 4.62 2 [yoga] 1 [vrouw] 42.8
## 5 2 15 6 2.32 1 [fitness] 0 [man] 45.4
## 6 264 30 4 3.34 3 [controle] 1 [vrouw] 45.4
Tranform data: correct variable types
data <- data %>% arrange(Respnum, Tijd)
data <- data %>% mutate(
Respnum = factor(Respnum),
Vestiging = factor(Vestiging),
Conditie = as.double(Conditie),
Sekse = as.double(Sekse))
# Change values in the 'Conditie' column
data$Conditie[data$Conditie == 1] <- "fitness"
data$Conditie[data$Conditie == 2] <- "yoga"
data$Conditie[data$Conditie == 3] <- "controle"
# Change values in the 'Sekse' column
data$Sekse[data$Sekse == 0] <- "man"
data$Sekse[data$Sekse == 1] <- "vrouw"
data <- data %>% mutate(
Conditie = factor(Conditie, levels = c("controle","yoga","fitness")),
Sekse = factor(Sekse, levels = c("vrouw","man")))
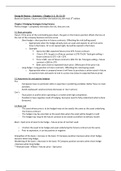
, 3. Descriptive statistics
Check how sound the data is
print(
jmv::descriptives(
vars = c("Burnout", "Tijd", "Conditie", "Sekse", "Leeftijd"),
freq = TRUE,
data = data,
desc = "rows")
)
##
## DESCRIPTIVES
##
## Descriptives
##
─────────────────────────────────────────────────────────────────────────────
───────────────────
## N Missing Mean Median SD
Minimum Maximum
##
─────────────────────────────────────────────────────────────────────────────
───────────────────
## Burnout 2160 0 4.451827 4.296333 1.995177
0.6589023 10.000000
## Tijd 2160 0 3.507870 3.000000 2.293825
0.0000000 7.000000
## Conditie 2160 0
## Sekse 2160 0
## Leeftijd 2160 0 45.732342 46.061806 7.809702
18.2605629 67.153295
##
─────────────────────────────────────────────────────────────────────────────
───────────────────
##
##
## FREQUENCIES
##
## Frequencies of Conditie
## ────────────────────────────────────────────────────
## Conditie Counts % of Total Cumulative %
## ────────────────────────────────────────────────────
## controle 717 33.19444 33.19444
## yoga 719 33.28704 66.48148
## fitness 724 33.51852 100.00000
## ────────────────────────────────────────────────────
knitr::opts_chunk$set(width.cutoff = 50)
1. Load in required libraries
library(nlme)
library(emmeans)
## Welcome to emmeans.
## Caution: You lose important information if you filter this package's
results.
## See '? untidy'
library(jmv)
library(jmvcore)
##
## Attaching package: 'jmvcore'
## The following objects are masked from 'package:base':
##
## endsWith, format, startsWith
library(jmvconnect)
library(haven)
library(GAMLj3)
library(patchwork)
library(tidyverse)
## ── Attaching core tidyverse packages ──────────────────────── tidyverse
2.0.0 ──
## ✔ dplyr 1.1.4 ✔ readr 2.1.5
## ✔ forcats 1.0.0 ✔ stringr 1.5.1
## ✔ ggplot2 3.5.1 ✔ tibble 3.2.1
## ✔ lubridate 1.9.3 ✔ tidyr 1.3.1
## ✔ purrr 1.0.2
## ── Conflicts ──────────────────────────────────────────
tidyverse_conflicts() ──
## ✖ dplyr::collapse() masks nlme::collapse()
## ✖ dplyr::filter() masks stats::filter()
## ✖ dplyr::lag() masks stats::lag()
,## ✖ dplyr::select() masks jmvcore::select()
## ℹ Use the conflicted package (<http://conflicted.r-lib.org/>) to force
all conflicts to become errors
2. Read in the data
data <- read_sav("DATA251_vanMeegen_Browaeys.sav")
print(head(data))
## # A tibble: 6 × 7
## Respnum Vestiging Tijd Burnout Conditie Sekse Leeftijd
## <dbl> <dbl> <dbl> <dbl> <dbl+lbl> <dbl+lbl> <dbl>
## 1 108 29 4 3.59 2 [yoga] 0 [man] 37.0
## 2 34 8 3 2.95 1 [fitness] 0 [man] 30.8
## 3 31 23 2 3.80 1 [fitness] 0 [man] 43.3
## 4 151 5 1 4.62 2 [yoga] 1 [vrouw] 42.8
## 5 2 15 6 2.32 1 [fitness] 0 [man] 45.4
## 6 264 30 4 3.34 3 [controle] 1 [vrouw] 45.4
Tranform data: correct variable types
data <- data %>% arrange(Respnum, Tijd)
data <- data %>% mutate(
Respnum = factor(Respnum),
Vestiging = factor(Vestiging),
Conditie = as.double(Conditie),
Sekse = as.double(Sekse))
# Change values in the 'Conditie' column
data$Conditie[data$Conditie == 1] <- "fitness"
data$Conditie[data$Conditie == 2] <- "yoga"
data$Conditie[data$Conditie == 3] <- "controle"
# Change values in the 'Sekse' column
data$Sekse[data$Sekse == 0] <- "man"
data$Sekse[data$Sekse == 1] <- "vrouw"
data <- data %>% mutate(
Conditie = factor(Conditie, levels = c("controle","yoga","fitness")),
Sekse = factor(Sekse, levels = c("vrouw","man")))
, 3. Descriptive statistics
Check how sound the data is
print(
jmv::descriptives(
vars = c("Burnout", "Tijd", "Conditie", "Sekse", "Leeftijd"),
freq = TRUE,
data = data,
desc = "rows")
)
##
## DESCRIPTIVES
##
## Descriptives
##
─────────────────────────────────────────────────────────────────────────────
───────────────────
## N Missing Mean Median SD
Minimum Maximum
##
─────────────────────────────────────────────────────────────────────────────
───────────────────
## Burnout 2160 0 4.451827 4.296333 1.995177
0.6589023 10.000000
## Tijd 2160 0 3.507870 3.000000 2.293825
0.0000000 7.000000
## Conditie 2160 0
## Sekse 2160 0
## Leeftijd 2160 0 45.732342 46.061806 7.809702
18.2605629 67.153295
##
─────────────────────────────────────────────────────────────────────────────
───────────────────
##
##
## FREQUENCIES
##
## Frequencies of Conditie
## ────────────────────────────────────────────────────
## Conditie Counts % of Total Cumulative %
## ────────────────────────────────────────────────────
## controle 717 33.19444 33.19444
## yoga 719 33.28704 66.48148
## fitness 724 33.51852 100.00000
## ────────────────────────────────────────────────────