LECTURE 1 – WEEK 1: about this course + R and RStudio VSR
SEMESTER 1 | ERIKA TSINGOSI + YANN HAUTIER
ABOUT THIS COURSE
● learning goals
○ expand statistics toolbox
○ reason about appropriate experimental approaches
and statistical tools
○ critically evaluate analyses and outputs
○ learn the basics of data science
○ master the tools for creating a reproducible analysis
in R
● final grade must be ≥ 5.5
○ attend all computer sessions ● ?lm or help(lm) gives you help on the lm function
○ complete weekly quizzes ● helpful sources
○ complete all 4 hand-in assignments (30%) ○ http://tryr.codeschool.com/
○ pass the exam with a grade ≥ 5.5 (70%) ○ http://www.cookbook-r.com/
○ https://thecrashcourse.com/courses/what-is%20stat
istics-crash-course-statistics-1/
R AND RSTUDIO
● outlier has a huge impact on linear regression
● statistics are done in R not RStudio; Rstudio is the tool
○ RStudio is an IDE for R
● you have to annotate your script using #
● R automatically creates a code when you click on Import
Dataset which you need to paste in the script and save
● library() #get a list of all installed packages
● install.packages("ggplot2") #to install a package
● library(‘’ggplot2’’) #to load a package
○ no need to install a package again after it has been
installed, but it’s important to load it again
● hand in assignments need to be in pdf
● ggplot2 = grammar of graphics
○ https://ggplot2.tidyverse.org/
○ http://www.cookbook-r.com/Graphs/
1
, LECTURE 2 – WEEK 1: fundamentals of statistics VSR
SEMESTER 1 | ERIKA TSINGOSI + YANN HAUTIER
○ n – 1 is used because you might get outliers by chance
FUNDAMENTALS OF STATISTICS when you take a sample
⎯ sample measurements are on average closer to their
own mean than to the true mean of the population;
SAMPLING
subtracting by 1 can correct for that bias when the
sample size is small
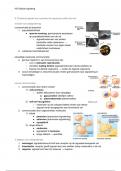
● flowchart of a study ○ Ȳ is a random variable
○ execution; while you're collecting data, you should already
make plots to see if the data makes sense
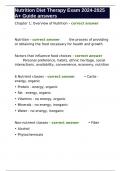
● to find the distribution of Ȳ we sample multiple times
○ when you add the different samples, you get the sampling
distribution of the sample mean Ȳ
○ sampling distribution of Ȳ is a t-distribution
⎯ t-distribution has a lower peak and fatter tails than the
normal distribution
● statistics quantifies uncertainty; statistics is about making sense
of the variation (in samples)
○ descriptive statistics quantify
⎯ location or central tendency of data; mean, median
⎯ spread of the data; range, standard deviation
○ comparative statistics
⎯ compare different groups
⎯ based on location and spread
⎯ How likely is the sample compatible with our
expectation?
● population distribution; ideal value we’d know if we’d have
perfect knowledge of measured individuals (almost always
impossible to measure)
○ most common measures for location and spread for a
population distribution are mean (μ) and standard
deviation (σ)
⎯ μ: sum of each individual measurement divided by the ○ mu hat: mean of the sampling distribution of Ȳ
total number of measurements which is an estimate for the population mean (μ)
⎯ σ: you square each measurement subtracted from the ⎯ you sum the sample means and divide it by the
mean → sum the squares → divide it by the total
number of samples
number of measurements → take square root;
○ σȲ = standard deviation of the population / square
standard deviation is the square root of the variance
⎯ population μ and σ are constant (they are not random root of the sample size
and don’t change, because the population is always ○ we usually don’t have the population standard
the same) deviation σ → that's why we estimate the spread of
Ȳ (standard error of the mean) with the sample
standard deviation s
⎯ the estimate is the standard error of the mean =
sample standard deviation / square root of the
sample size
● sample distribution; random subset of the population
○ sample mean (Ȳ) and sample standard deviation (s)
2
SEMESTER 1 | ERIKA TSINGOSI + YANN HAUTIER
ABOUT THIS COURSE
● learning goals
○ expand statistics toolbox
○ reason about appropriate experimental approaches
and statistical tools
○ critically evaluate analyses and outputs
○ learn the basics of data science
○ master the tools for creating a reproducible analysis
in R
● final grade must be ≥ 5.5
○ attend all computer sessions ● ?lm or help(lm) gives you help on the lm function
○ complete weekly quizzes ● helpful sources
○ complete all 4 hand-in assignments (30%) ○ http://tryr.codeschool.com/
○ pass the exam with a grade ≥ 5.5 (70%) ○ http://www.cookbook-r.com/
○ https://thecrashcourse.com/courses/what-is%20stat
istics-crash-course-statistics-1/
R AND RSTUDIO
● outlier has a huge impact on linear regression
● statistics are done in R not RStudio; Rstudio is the tool
○ RStudio is an IDE for R
● you have to annotate your script using #
● R automatically creates a code when you click on Import
Dataset which you need to paste in the script and save
● library() #get a list of all installed packages
● install.packages("ggplot2") #to install a package
● library(‘’ggplot2’’) #to load a package
○ no need to install a package again after it has been
installed, but it’s important to load it again
● hand in assignments need to be in pdf
● ggplot2 = grammar of graphics
○ https://ggplot2.tidyverse.org/
○ http://www.cookbook-r.com/Graphs/
1
, LECTURE 2 – WEEK 1: fundamentals of statistics VSR
SEMESTER 1 | ERIKA TSINGOSI + YANN HAUTIER
○ n – 1 is used because you might get outliers by chance
FUNDAMENTALS OF STATISTICS when you take a sample
⎯ sample measurements are on average closer to their
own mean than to the true mean of the population;
SAMPLING
subtracting by 1 can correct for that bias when the
sample size is small
● flowchart of a study ○ Ȳ is a random variable
○ execution; while you're collecting data, you should already
make plots to see if the data makes sense
● to find the distribution of Ȳ we sample multiple times
○ when you add the different samples, you get the sampling
distribution of the sample mean Ȳ
○ sampling distribution of Ȳ is a t-distribution
⎯ t-distribution has a lower peak and fatter tails than the
normal distribution
● statistics quantifies uncertainty; statistics is about making sense
of the variation (in samples)
○ descriptive statistics quantify
⎯ location or central tendency of data; mean, median
⎯ spread of the data; range, standard deviation
○ comparative statistics
⎯ compare different groups
⎯ based on location and spread
⎯ How likely is the sample compatible with our
expectation?
● population distribution; ideal value we’d know if we’d have
perfect knowledge of measured individuals (almost always
impossible to measure)
○ most common measures for location and spread for a
population distribution are mean (μ) and standard
deviation (σ)
⎯ μ: sum of each individual measurement divided by the ○ mu hat: mean of the sampling distribution of Ȳ
total number of measurements which is an estimate for the population mean (μ)
⎯ σ: you square each measurement subtracted from the ⎯ you sum the sample means and divide it by the
mean → sum the squares → divide it by the total
number of samples
number of measurements → take square root;
○ σȲ = standard deviation of the population / square
standard deviation is the square root of the variance
⎯ population μ and σ are constant (they are not random root of the sample size
and don’t change, because the population is always ○ we usually don’t have the population standard
the same) deviation σ → that's why we estimate the spread of
Ȳ (standard error of the mean) with the sample
standard deviation s
⎯ the estimate is the standard error of the mean =
sample standard deviation / square root of the
sample size
● sample distribution; random subset of the population
○ sample mean (Ȳ) and sample standard deviation (s)
2