COMM121 PRACTICE EXAMS ALREADY PASSED 2023/2024
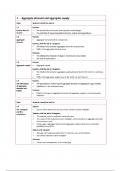
Key Definitions - POPULATION: all members of a group which you want to draw a conclusion. SAMPLE: a portion of the population. PARAMETER: numerical measure, describes a characteristic of population STATISTIC: numerical measure, describes a characteristic of sample. E.g. Population; all people on the electoral role in QLD. Sample; people who are on electoral role in QLD and live in Brisbane. Types of data - CATEGORICAL: categories e.g. marital status, hair colour, gender. NUMERICAL: (Discrete) counted items, finite number e.g. number of children, number of people with O blood group. (Numerical) measured characteristics, infinite number of items e.g. weight, height Level of measurement - RATIO DATA: true zero exists e.g height, weight, age, weekly food spending. INTERVAL DATA: no true zero e.g temperature, standardised exam score. ORDINAL: ordered categories e.g. rankings in tennis tournament, student grades. NOMINAL DATA: no order in categories e.g. marital status, type of car, gender, hair colour. Presenting data - Summary table, bar and pie charts, bar charts. Bar charts and pie charts are used for qualitative data, for comparing categories. Pie charts preferred for observing portion of the total. Ordered array: sequence of data in rank order, range min to max e.g. 1, 4 ,6, 8. helps identify outliers and range. Stem and leaf plot: see distribution easier. Class intervals and boundaries - Each data value belongs to one class, with the same width. determine width of each interval by: range/number of desired class groupings. At least 5 but no more than 15 groupings. 1. Sort data in ascending order 3.60, 4.13, 5.38, 7.21, 8.19, 9.31, 13.04, 13.08, 22.04, 22.72, 24.55, 25.75, 26.79, 28.35, 30.78, 33.49, 34.37, 37.97, 51.80, 61.07 2. Find Range 61.07 - 3.60 = 57.47 3. Select number of classes 7 (between 5 and 15) 4. Compute class interval (width): (57.47/7)~10 5. Determine class boundaries (limits): 0, 10, 20, 30, 40, 50, 60, 70 6. Compute class midpoints: 5, 15, 25, 35, 45, 55, 65 Time series plot - One variable is measured on vertical axis and the time period is measure on the horizontal axis. Measures of central tendency - MEAN: Calculate the sum of values, divide by the number of values, affected by extreme values (outliers) MEDIAN:

Geschreven voor
- Instelling
- College biochem
- Vak
- College biochem
Documentinformatie
- Geüpload op
- 27 juni 2024
- Aantal pagina's
- 6
- Geschreven in
- 2023/2024
- Type
- Tentamen (uitwerkingen)
- Bevat
- Vragen en antwoorden
Onderwerpen
-
comm121 practice exams already passed