Assignments
,Statistics Applied to Psychology I Oct/31st/2023
Last name: __________________________________________ First name: __________________________
ASSIGNMENT 1 – UNIVARIATE DESCRIPTIVE STATISTICS
− This assignment contains seven exercises. Please, read each question carefully before answering it.
− You can work on the exercises in groups and you can check your class notes and course lecture notes for
reference if needed. However, your final answers must reflect your own elaboration and you should work
by yourself when submitting the assignment online.
− All computations must be carried out with the only help of a basic calculator. Plots must be hand-made.
1. In a pilot study on the efficacy of Psychological Capital Intervention (PCI) for depression, Song, Sun, & Song
(2019) investigated whether this technique, based on developing positive resources (hope, self-efficacy,
optimism, and resilience), help reduce depression symptoms. You can find the paper reporting their
study appended to the end of this document. Please, read it now (especially the introduction and the
section on materials and methods) for full context.
a. Identify the psychological variables under study. How were they measured? Which type are them?
Justify your answer.
b. Use the information provided in the paper to compute the overall (i.e., combined) variance for scores
on the Center for Epidemiological Studies Depression Scale (CES-D) before intervention.
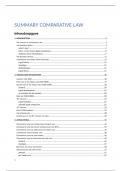
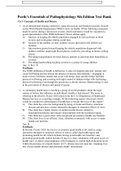
c. The table on the right shows simulated depression CES-D scores
data (i.e., CES-D scores) for a subset of the PCI group Subject # PCI pre-test PCI post-test
tested before (“pre-test”) and after (“post-test”) the 1 21 15
intervention. Produce hand-made boxplots of 2 18 15
depression scores under the two conditions and 3 39 30
4 24 18
compare them. Address central tendency, variability,
5 42 27
and skewness. Show all your workings. 6 39 24
7 39 27
8 18 12
9 15 12
10 18 12
11 36 24
12 33 21
13 27 15
14 24 15
15 12 12
16 42 45
17 21 12
18 36 24
19 33 21
20 30 18
2. Suppose you work for a clinic where there are 50 patients with symptoms of depression. In order to select
those patients who would really benefit from PCI, you come up with a 2-stages procedure. On the first
stage, all patients are administered CES-D and only the 15 patients who obtained the highest scores
Lecturer: Rocío Alcalá-Quintana Page 1 of 2
Teaching assistant: Sofiya-Mariya Vovk
, Statistics Applied to Psychology I Oct/31st/2023
progressed to the next stage. On the second stage, those 15 patients are given the Positive PsyCap
Questionnaire (PPQ) and only the 12 patients who showed the lowest scores on psychological capital were
sent to intervention.
a. What statistic must you calculate to set cut-off scores for the first stage? Why?
b. What statistic must you calculate to set cut-off scores for the second stage? Why?
3. Make up and plot two data sets with N = 10 that have: · 20
a. the same mean but differ in standard deviations,
b. the same standard deviation but differ in means, eve ,
c. the same mean but have different medians, 7 19
d. the same median but different means, and
e. the same interquartile range but differ in standard deviations. 14
Note. You will only be asked to upload your answer to one of the five sections of this exercise.
ev 7
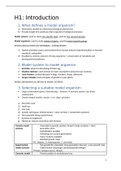
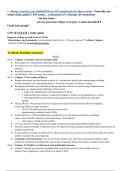
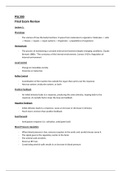
4. Pictograms are gaining popularity as a more intuitive response,format in surveys and questionnaires. For
instance, the Self-Assessment Manikin (SAM) is an instrument to directly assess pleasure, arousal, and
dominance associated with a person’s reaction to an object or event. For the arousal dimension depicted
below, SAM ranges from an excited, wide-eyed figure (leftmost manikin) to a relaxed sleepy figure
(rightmost manikin).
Arousal dimension of SAM (from Hodes, Cook, & Lang, 1985, Psychophysiology, 22, 545‒560).
a. What is the most appropriate statistic to obtain the average level of arousal of a group of students
before their Statistics final exam, based on their responses using SAM? Justify your choice.
b. Suppose that you decide to keep a daily registry or your arousal level before each exam during a whole
semester using SAM. At the end of the semester, your registry contains 17 observations. What statistic
must be calculated to evaluate stability of your arousal level? Justify your choice.
Hint. Code numerically the ratings yielded by SAM before answering the questions above.
5. Suppose that you have scores on a free-recall task to test memory for a sample of first-year students and
a sample of final-year students (4th year). What statistic must be calculated to find out whether final-year
students have, in general, better memory abilities (based on obtained data from free recall task only) than
first-year students do? Why?
6. What statistic must be calculated to determine which symptom of ADHD (Attention deficit hyperactivity
disorder) is the most prevalent in the age range 5-10? Why?
7. A sample of data on variable X with a mean of 55 and a variance of 36 is being converted to a derived-
score scale, G, so that the new mean and variance will respectively be 50 and 100. What value Gi will be
obtained after transformation for a raw score of Xi = 58? Show your workings.
Lecturer: Rocío Alcalá-Quintana Page 2 of 2
Teaching assistant: Sofiya-Mariya Vovk
,Statistics Applied to Psychology I Oct/31st/2023
Last name: __________________________________________ First name: __________________________
ASSIGNMENT 1 – UNIVARIATE DESCRIPTIVE STATISTICS
− This assignment contains seven exercises. Please, read each question carefully before answering it.
− You can work on the exercises in groups and you can check your class notes and course lecture notes for
reference if needed. However, your final answers must reflect your own elaboration and you should work
by yourself when submitting the assignment online.
− All computations must be carried out with the only help of a basic calculator. Plots must be hand-made.
1. In a pilot study on the efficacy of Psychological Capital Intervention (PCI) for depression, Song, Sun, & Song
(2019) investigated whether this technique, based on developing positive resources (hope, self-efficacy,
optimism, and resilience), help reduce depression symptoms. You can find the paper reporting their
study appended to the end of this document. Please, read it now (especially the introduction and the
section on materials and methods) for full context.
a. Identify the psychological variables under study. How were they measured? Which type are them?
Justify your answer.
b. Use the information provided in the paper to compute the overall (i.e., combined) variance for scores
on the Center for Epidemiological Studies Depression Scale (CES-D) before intervention.
c. The table on the right shows simulated depression CES-D scores
data (i.e., CES-D scores) for a subset of the PCI group Subject # PCI pre-test PCI post-test
tested before (“pre-test”) and after (“post-test”) the 1 21 15
intervention. Produce hand-made boxplots of 2 18 15
depression scores under the two conditions and 3 39 30
4 24 18
compare them. Address central tendency, variability,
5 42 27
and skewness. Show all your workings. 6 39 24
7 39 27
8 18 12
9 15 12
10 18 12
11 36 24
12 33 21
13 27 15
14 24 15
15 12 12
16 42 45
17 21 12
18 36 24
19 33 21
20 30 18
2. Suppose you work for a clinic where there are 50 patients with symptoms of depression. In order to select
those patients who would really benefit from PCI, you come up with a 2-stages procedure. On the first
stage, all patients are administered CES-D and only the 15 patients who obtained the highest scores
Lecturer: Rocío Alcalá-Quintana Page 1 of 2
Teaching assistant: Sofiya-Mariya Vovk
, Statistics Applied to Psychology I Oct/31st/2023
progressed to the next stage. On the second stage, those 15 patients are given the Positive PsyCap
Questionnaire (PPQ) and only the 12 patients who showed the lowest scores on psychological capital were
sent to intervention.
a. What statistic must you calculate to set cut-off scores for the first stage? Why?
b. What statistic must you calculate to set cut-off scores for the second stage? Why?
3. Make up and plot two data sets with N = 10 that have: · 20
a. the same mean but differ in standard deviations,
b. the same standard deviation but differ in means, eve ,
c. the same mean but have different medians, 7 19
d. the same median but different means, and
e. the same interquartile range but differ in standard deviations. 14
Note. You will only be asked to upload your answer to one of the five sections of this exercise.
ev 7
4. Pictograms are gaining popularity as a more intuitive response,format in surveys and questionnaires. For
instance, the Self-Assessment Manikin (SAM) is an instrument to directly assess pleasure, arousal, and
dominance associated with a person’s reaction to an object or event. For the arousal dimension depicted
below, SAM ranges from an excited, wide-eyed figure (leftmost manikin) to a relaxed sleepy figure
(rightmost manikin).
Arousal dimension of SAM (from Hodes, Cook, & Lang, 1985, Psychophysiology, 22, 545‒560).
a. What is the most appropriate statistic to obtain the average level of arousal of a group of students
before their Statistics final exam, based on their responses using SAM? Justify your choice.
b. Suppose that you decide to keep a daily registry or your arousal level before each exam during a whole
semester using SAM. At the end of the semester, your registry contains 17 observations. What statistic
must be calculated to evaluate stability of your arousal level? Justify your choice.
Hint. Code numerically the ratings yielded by SAM before answering the questions above.
5. Suppose that you have scores on a free-recall task to test memory for a sample of first-year students and
a sample of final-year students (4th year). What statistic must be calculated to find out whether final-year
students have, in general, better memory abilities (based on obtained data from free recall task only) than
first-year students do? Why?
6. What statistic must be calculated to determine which symptom of ADHD (Attention deficit hyperactivity
disorder) is the most prevalent in the age range 5-10? Why?
7. A sample of data on variable X with a mean of 55 and a variance of 36 is being converted to a derived-
score scale, G, so that the new mean and variance will respectively be 50 and 100. What value Gi will be
obtained after transformation for a raw score of Xi = 58? Show your workings.
Lecturer: Rocío Alcalá-Quintana Page 2 of 2
Teaching assistant: Sofiya-Mariya Vovk