Samenvatting toets algemene deel Methoden Techniek & Statistiek 3 (MTS3). Dit gedeelde is in het Engels gegeven dus de samenvatting is ook in het Engels. Ik heb dit vak zelf met een 9,5 afgerond (9,5 voor dit tentamen, 10 voor de SPSS-toets en een 9,1 voor het studiepadspecifieke deel). Kijk voor m...
deze duidelijke verslag helpt je om te slagen voor je examen
Samenvatting Discovering Statistics Using IBM SPSS Statistics Field SPSS - Multivariate Data Analysis
Alles voor dit studieboek (315)
Geschreven voor
Universiteit Utrecht (UU)
Psychologie
Methoden, technieken en statistiek 3 / MTS 3
Alle documenten voor dit vak (5)
2
beoordelingen
Door: RozaM • 4 jaar geleden
Incompleet
Door: lotteflikkema • 4 jaar geleden
Verkoper
Volgen
bcrose
Ontvangen beoordelingen
Voorbeeld van de inhoud
Summary MTS3
Week 1. Regression
Regression is about a simple linear model which calculates the outcome with the
correlaton coefcient (b or r) and the error.
A simple regression formula is: y = b0 + b1*X1 + e
- b0: the point where the line intersects the vertcal aais of the graph.
- b1: the slope of the line. A positve b1 describes a positve correlatonn where a
negatve b1 describes a negatve correlaton.
- X1: the predictve factor that afects the outcome y.
- E: the standard error for the partcipant (i).
More variables can be added in the formula as b2n b3 etc.
Y = (b0 + b1*X1 + b2*X2) + e
- Y: the outcome variable (DV).
- B1: the coefcient of the rrst predictor (X1) (IV).
- B2: the coefcient of the second predictor (X2) (IV).
With one predictve value we speak of a simple regressionn but when there are multple
predictve values we speak of multiple regression.
Predicting the model
Residues: the diferences between the predicted values and the observed values.
- Positve residue: when the observed values are greater than the predicted values.
- Negatve residue: when the observed values are smaller than the predicted values.
Sum of squared residue/residue sum of squares (SSy): to easily calculate with the
residualsn the residue values are squared and added together. This gives an idea of how
much ‘error’ there is in the model.
Goodness fi of ihe model: does the model rt with the observed data?
Sum squared diferences/ioial sum of squares (SSi): total amount between the base
model (predicted values) and the observed data. We can use the mean/average to to
answer the queston above.
Model sum of squares (SSm): the diference between SSt and SSy. When a beter rtng
model is added there is an improvement in the SSyn this can be compared by calculatng
SSm. When the SSm is very largen the regression model is very diferent from the
average. When the SSm is very smalln then the regression model is beter to use instead
of the average.
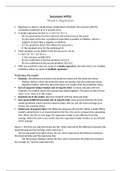
Figure 1. The rrst one (top lef) shows the SSTn which represents the diference between the
observed data and the average of the outcome Y.
The second graph (top right) shows the SSyn which represents the diference between
the observed data and the regression line.
The third graph (botom) shows the SSmn which represents the diference between
the average of Y and the regression line.
, R2 is the amount of variance in the outcome which is eaplained by the model (SSm)n
relatve to how much variance there was already in the rrst place (SSt). This can be
calculated by the formula: R2 = (SSm/SSt)
Mean squares of MS (MSm): the mean sum of squares; used to calculate the F-rato. This
can be calculated by the formula: F = (MSm/MSr)
F-ratio: calculates the diference between the predicted values and the observed values.
If the model is goodn we eapect great improvements in the predicted values where MSm
is large. With a small diference between the observed data and the modeln MSr is small.
A great model should have a large F-raton with a value larger than 1.
- To calculate the signircance from R2 we can use this formula:
F = ((N-k-1)R2) / (k(1-R2))
N is the number of partcipants; k is the number of variables in the model.
This F tests the null-hypothesis where R2 = 0.
Assessing individual predictve factors
Voordelen van het kopen van samenvattingen bij Stuvia op een rij:
√ Verzekerd van kwaliteit door reviews
Stuvia-klanten hebben meer dan 700.000 samenvattingen beoordeeld. Zo weet je zeker dat je de beste documenten koopt!
Snel en makkelijk kopen
Je betaalt supersnel en eenmalig met iDeal, Bancontact of creditcard voor de samenvatting. Zonder lidmaatschap.
Focus op de essentie
Samenvattingen worden geschreven voor en door anderen. Daarom zijn de samenvattingen altijd betrouwbaar en actueel. Zo kom je snel tot de kern!
Veelgestelde vragen
Wat krijg ik als ik dit document koop?
Je krijgt een PDF, die direct beschikbaar is na je aankoop. Het gekochte document is altijd, overal en oneindig toegankelijk via je profiel.
Tevredenheidsgarantie: hoe werkt dat?
Onze tevredenheidsgarantie zorgt ervoor dat je altijd een studiedocument vindt dat goed bij je past. Je vult een formulier in en onze klantenservice regelt de rest.
Van wie koop ik deze samenvatting?
Stuvia is een marktplaats, je koop dit document dus niet van ons, maar van verkoper bcrose. Stuvia faciliteert de betaling aan de verkoper.
Zit ik meteen vast aan een abonnement?
Nee, je koopt alleen deze samenvatting voor €3,49. Je zit daarna nergens aan vast.