STA2020F Regression Summary Notes, 2019
Regression for STA2020F
William T. Msemburi1
Abstract
These notes provide a summary of the content covered in the regression section of the
STA2020F 2019 course. The purpose of these notes is to provide an overview of the regres-
sion core material in a condensed format to assist in the revision of the concepts - reinforcing
what is taught in more detail in the course lectures and what is described in the regression
section slides. In addition, relevant RStudio code and examples are shown.
1 Lecturer, Department of Statistics, University of Cape Town, South Africa
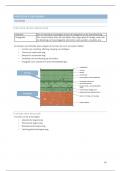
Contents Scatter Diagrams
A first step in any correlation/regression analysis
1 Correlation 1 should be a plot of the data. The basic graphical
2 Simple Linear Regression 2 technique for the two-variable situation is the scat-
ter diagram. In general the data refer to a num-
3 Multiple (Linear) Regression 5
ber of individuals, each of which provides observa-
4 Model building 10 tions on two variables. In the scatter diagram each
5 Logistic regression 12 variable is allotted one of two co-ordinate axes and
each observation defines a point, of which the co-
ordinates are the observed values of the two vari-
1. Correlation ables. The scatter diagram gives a compact illustra-
tion of the relationship between the two variables.
Introduction For example we may want to quantify the relation-
Regression and correlation analyses are techniques ship between the age of a child (months) and a
for quantifying the relationship between two or more child’s height (cm):
continuous variables. You make this kind of re-
lationships in your head all the time, for example Table 1. Age and Height data
when you calculate the age of a child based on her
height, you are assuming the older she is, the taller Age Height
she will be. We shall concentrate on situations in 18 76.1
which the general trend is linear; that is, as one vari- 19 77.1
able changes the other variable follows on the aver- 20 78.1
age a trend which can be represented by a straight 21 78.2
line. Our objectives in the Correlation section are 22 78.8
to learn about: 23 79.7
24 79.9
25 81.1
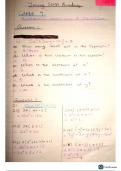
1. Visualising data using a scatter-plot. 26 81.2
2. The definition and properties of the correla- 27 81.8
tion coefficient. 28 82.8
3. Estimating and interpreting the correlation 29 83.5
coefficient.
, Regression for STA2020F — 2/15
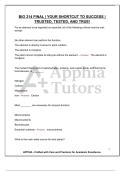
In RStudio we input the data and generate the 2. Simple Linear Regression
plots using:
Introduction
Age = c(18,19,20,21,22,23,24,25, Simple Linear Regression is a technique for de-
26,27,28,29) scribing the relationship between the values of two
Height = c(76.1,77.1,78.1,78.2,78.8, continuous variables that enables us to predict the
79.7,79.9,81.1,81.2,81.8,82.8,83.5) value of one variable for an individual when we
only know the value of the other variable. Lin-
plot(Age,Height, main="Height ˜ Age")
ear regression refers to a straight line relationship
between variables. Simple linear regression refers
Height ~ Age
to the situation where there is only one explanato-
ry/independent variable. The method fits a straight
line to the data that in some sense gives the “best”
82
prediction of y for any value of x. This will be a
line that minimises the distance between the data
and the fitted line. Our objectives in the Simple
Height
80
Linear Regression section are to learn:
1. The parameters of the mathematical model
78
for such a relationship
2. How to estimate the parameters of this model
using RStudio
76
18 20 22 24 26 28 3. How to interpret the meanings of the esti-
Age
mated parameters
We observe that there is positive linear relationship 4. How to test if the relationship is statistically
and proceed to quantify it. significant
5. How to predict values of y given a new value
Correlation coefficient of the explanatory variable x.
The strength of the linear association between two 6. How to set up confidence intervals for the es-
variables y and x can be summarised by the sample timates and predicted values.
correlation coefficient, rxy . For n pairs of observa-
tions (yi , xi ), i = 1 . . . n, the correlation coefficient The Linear Model
is defined by: We assume
∑n (xi − x̄)(yi − ȳ) SSxy y = β0 + β1 x + ε where ε ∼ N(0, σ 2 )
rxy = √ n i =√
∑i (xi − x̄) ∑i (yi − ȳ)
2 n 2 SSx SSy In this expression:
where x̄ = the mean of the n values for x and ȳ = the • y =⇒ Response /Dependent variable,
mean of the n values for y. Note that the correlation • β0 =⇒ Intercept/Expected value of y when
coefficient is a dimensionless quantity between -1 x = 0,
and +1. In RStudio this correlation coefficient • β1 =⇒ Regression coefficient/Slope of the
is estimated using line/ Amount of change in y for a 1 unit change
in x,
cor(Age, Height) • x =⇒ Predictor/Independent variable,
• ε =⇒ Error term (since not all points will
## [1] 0.9942309 lie on the line exactly).
In this course, we do not perform any hypothesis Estimates are derived using RStudio as shown
tests related to rxy . in Figure 1.
Regression for STA2020F
William T. Msemburi1
Abstract
These notes provide a summary of the content covered in the regression section of the
STA2020F 2019 course. The purpose of these notes is to provide an overview of the regres-
sion core material in a condensed format to assist in the revision of the concepts - reinforcing
what is taught in more detail in the course lectures and what is described in the regression
section slides. In addition, relevant RStudio code and examples are shown.
1 Lecturer, Department of Statistics, University of Cape Town, South Africa
Contents Scatter Diagrams
A first step in any correlation/regression analysis
1 Correlation 1 should be a plot of the data. The basic graphical
2 Simple Linear Regression 2 technique for the two-variable situation is the scat-
ter diagram. In general the data refer to a num-
3 Multiple (Linear) Regression 5
ber of individuals, each of which provides observa-
4 Model building 10 tions on two variables. In the scatter diagram each
5 Logistic regression 12 variable is allotted one of two co-ordinate axes and
each observation defines a point, of which the co-
ordinates are the observed values of the two vari-
1. Correlation ables. The scatter diagram gives a compact illustra-
tion of the relationship between the two variables.
Introduction For example we may want to quantify the relation-
Regression and correlation analyses are techniques ship between the age of a child (months) and a
for quantifying the relationship between two or more child’s height (cm):
continuous variables. You make this kind of re-
lationships in your head all the time, for example Table 1. Age and Height data
when you calculate the age of a child based on her
height, you are assuming the older she is, the taller Age Height
she will be. We shall concentrate on situations in 18 76.1
which the general trend is linear; that is, as one vari- 19 77.1
able changes the other variable follows on the aver- 20 78.1
age a trend which can be represented by a straight 21 78.2
line. Our objectives in the Correlation section are 22 78.8
to learn about: 23 79.7
24 79.9
25 81.1
1. Visualising data using a scatter-plot. 26 81.2
2. The definition and properties of the correla- 27 81.8
tion coefficient. 28 82.8
3. Estimating and interpreting the correlation 29 83.5
coefficient.
, Regression for STA2020F — 2/15
In RStudio we input the data and generate the 2. Simple Linear Regression
plots using:
Introduction
Age = c(18,19,20,21,22,23,24,25, Simple Linear Regression is a technique for de-
26,27,28,29) scribing the relationship between the values of two
Height = c(76.1,77.1,78.1,78.2,78.8, continuous variables that enables us to predict the
79.7,79.9,81.1,81.2,81.8,82.8,83.5) value of one variable for an individual when we
only know the value of the other variable. Lin-
plot(Age,Height, main="Height ˜ Age")
ear regression refers to a straight line relationship
between variables. Simple linear regression refers
Height ~ Age
to the situation where there is only one explanato-
ry/independent variable. The method fits a straight
line to the data that in some sense gives the “best”
82
prediction of y for any value of x. This will be a
line that minimises the distance between the data
and the fitted line. Our objectives in the Simple
Height
80
Linear Regression section are to learn:
1. The parameters of the mathematical model
78
for such a relationship
2. How to estimate the parameters of this model
using RStudio
76
18 20 22 24 26 28 3. How to interpret the meanings of the esti-
Age
mated parameters
We observe that there is positive linear relationship 4. How to test if the relationship is statistically
and proceed to quantify it. significant
5. How to predict values of y given a new value
Correlation coefficient of the explanatory variable x.
The strength of the linear association between two 6. How to set up confidence intervals for the es-
variables y and x can be summarised by the sample timates and predicted values.
correlation coefficient, rxy . For n pairs of observa-
tions (yi , xi ), i = 1 . . . n, the correlation coefficient The Linear Model
is defined by: We assume
∑n (xi − x̄)(yi − ȳ) SSxy y = β0 + β1 x + ε where ε ∼ N(0, σ 2 )
rxy = √ n i =√
∑i (xi − x̄) ∑i (yi − ȳ)
2 n 2 SSx SSy In this expression:
where x̄ = the mean of the n values for x and ȳ = the • y =⇒ Response /Dependent variable,
mean of the n values for y. Note that the correlation • β0 =⇒ Intercept/Expected value of y when
coefficient is a dimensionless quantity between -1 x = 0,
and +1. In RStudio this correlation coefficient • β1 =⇒ Regression coefficient/Slope of the
is estimated using line/ Amount of change in y for a 1 unit change
in x,
cor(Age, Height) • x =⇒ Predictor/Independent variable,
• ε =⇒ Error term (since not all points will
## [1] 0.9942309 lie on the line exactly).
In this course, we do not perform any hypothesis Estimates are derived using RStudio as shown
tests related to rxy . in Figure 1.