Graphs For Summarising and
NOt all graphs can be used for
Displaying Data
because each type of data has all three types of data (viz catenorical discrete and continuou
different characteristics.
Types of data Graphs
Pie Chart
Show howthe
and can displaysample/population
is
the responses to onecomprised,
question only.
Have no axes, only a title.
Bar Graphs
o Show how many responses ofa particular type
were recoraed.
The sample/population is separated into various bars.
o The bars have spaces in between each other to indicate that each bar is unrelated to une
others.
O Tne y-axis is always anumber line that displays frequency, and the x-axis shOWs
categories. There is atitle.
Compound Bar Graphs
In addition to the above, each bar is subdivided into subcategories.
o Subcategory bars touch each other, but main category clusters have spaces in between
each cluster of bars.
Histograms
Used for grouped data.
Bars are used to indicate the frequency of each class (or group).
The bars touch each other to indicate that the numbers used to group the data (the class
boundaries) follow on from each other.
o The y-axis is always a number line that displays frequency, and the x-axis is a number
line. There is atitle.
The 'curve' that is formed by the top of the blocks can be used to interpret the spread of
the data.
Used to draw a Frequency Polygon.
(Broken) Line Graphs
Used to track howone 'thing' changes over time.
o A single (broken) line is used per item.
The x-axis is a number line that
the units used to measure the item always displays time, and the y-axis is a
(e.g. profit in Rand, height in cm). number line in
There is a title.
Rox and Whisker Graph - See
Uses the five values of thepage 16 of these notes (new in gr.9)
Only for ungrouped data (untilfive-number summary to illustrate the spread of the
o There is only one axis gr.11). data.
the x-axis is a
'items' are being measured with. number line that is in the same
units as what the
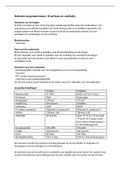
Gr.9
, used to representthe data type.
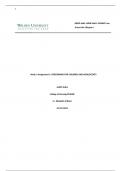
Inside each shape, write those graphsthat can be BOX
and
Whisker
and whésker
BOX
ContinuOUs
Discrete
Categorical
Statistics
and that are used as asummary of the data.
These are single values that are determined/calculated
and/or by describing how spread-out
Data can be summarised by describing the middle of the data,
(dispersed) the data is.
Measures of Central Tendency
a) Mode (or modal value)
-The data point(s) with the highest frequency the most commonly-occurring.
mode.
- There may be one, many or no values that are the
continuous data (then it is called the
- Applicable to categorical data, discrete data, or grouped
Modal Class)
b) Median (NB also a measure of dispersion)
- the value (mostly adata point) that has 50% of all data
smaller thanit.
If the point falls in between two values, then the median is the average of the two values (add
together and + 2).
- Applicable to discrete data.
c) Mean (X)
- This is acalculated statistic, and it is determined by adding together all data points and then
dividing by the number of data points.
- Applicable to either type of numerical data.
(Some) Measures of Dispersion (i.e. Spread) (See page 10 of these notes)
1. Range
-The difference between the maximum and the minimum values.
Indicates how spread-out the data is; the higher the range the more
spread-out the data is.
Inter Quartile Range (QR)-See page 11 of these notes
- The (newin ar.9)
difference between the third and the first guartiles.
Gr.9
, Revision Exercise
1) (Ungrouped Data)
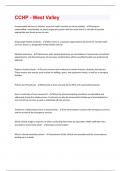
Stem and Leaf plots need to:
have a heading.
have a key showing how to read the plot e.g. key 4/1=41.
be organised into neat rows and columns and be in numericalorder. We usually Use
Columns in our chart, one for unordered leaves and one for the ordered leaveS.
The raw marks, out of 95, for a grade 9 maths exam are listed below:
61 32 43 65 82 46 37 S5 52, 44
80. 57 62 43 58 54 45 52 92
Draw up astem and leaf plot tO organise the data. and use it to calculate the mean and determine ie
median.
Key:
Stem Unordered Leaves Ordered Leaves
3 35 3
S 2 3 3 33
Mean:
Median:
Gr.9
Unit 11
NOt all graphs can be used for
Displaying Data
because each type of data has all three types of data (viz catenorical discrete and continuou
different characteristics.
Types of data Graphs
Pie Chart
Show howthe
and can displaysample/population
is
the responses to onecomprised,
question only.
Have no axes, only a title.
Bar Graphs
o Show how many responses ofa particular type
were recoraed.
The sample/population is separated into various bars.
o The bars have spaces in between each other to indicate that each bar is unrelated to une
others.
O Tne y-axis is always anumber line that displays frequency, and the x-axis shOWs
categories. There is atitle.
Compound Bar Graphs
In addition to the above, each bar is subdivided into subcategories.
o Subcategory bars touch each other, but main category clusters have spaces in between
each cluster of bars.
Histograms
Used for grouped data.
Bars are used to indicate the frequency of each class (or group).
The bars touch each other to indicate that the numbers used to group the data (the class
boundaries) follow on from each other.
o The y-axis is always a number line that displays frequency, and the x-axis is a number
line. There is atitle.
The 'curve' that is formed by the top of the blocks can be used to interpret the spread of
the data.
Used to draw a Frequency Polygon.
(Broken) Line Graphs
Used to track howone 'thing' changes over time.
o A single (broken) line is used per item.
The x-axis is a number line that
the units used to measure the item always displays time, and the y-axis is a
(e.g. profit in Rand, height in cm). number line in
There is a title.
Rox and Whisker Graph - See
Uses the five values of thepage 16 of these notes (new in gr.9)
Only for ungrouped data (untilfive-number summary to illustrate the spread of the
o There is only one axis gr.11). data.
the x-axis is a
'items' are being measured with. number line that is in the same
units as what the
Gr.9
, used to representthe data type.
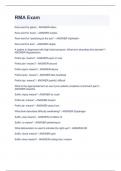
Inside each shape, write those graphsthat can be BOX
and
Whisker
and whésker
BOX
ContinuOUs
Discrete
Categorical
Statistics
and that are used as asummary of the data.
These are single values that are determined/calculated
and/or by describing how spread-out
Data can be summarised by describing the middle of the data,
(dispersed) the data is.
Measures of Central Tendency
a) Mode (or modal value)
-The data point(s) with the highest frequency the most commonly-occurring.
mode.
- There may be one, many or no values that are the
continuous data (then it is called the
- Applicable to categorical data, discrete data, or grouped
Modal Class)
b) Median (NB also a measure of dispersion)
- the value (mostly adata point) that has 50% of all data
smaller thanit.
If the point falls in between two values, then the median is the average of the two values (add
together and + 2).
- Applicable to discrete data.
c) Mean (X)
- This is acalculated statistic, and it is determined by adding together all data points and then
dividing by the number of data points.
- Applicable to either type of numerical data.
(Some) Measures of Dispersion (i.e. Spread) (See page 10 of these notes)
1. Range
-The difference between the maximum and the minimum values.
Indicates how spread-out the data is; the higher the range the more
spread-out the data is.
Inter Quartile Range (QR)-See page 11 of these notes
- The (newin ar.9)
difference between the third and the first guartiles.
Gr.9
, Revision Exercise
1) (Ungrouped Data)
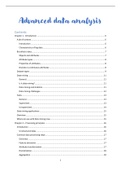
Stem and Leaf plots need to:
have a heading.
have a key showing how to read the plot e.g. key 4/1=41.
be organised into neat rows and columns and be in numericalorder. We usually Use
Columns in our chart, one for unordered leaves and one for the ordered leaveS.
The raw marks, out of 95, for a grade 9 maths exam are listed below:
61 32 43 65 82 46 37 S5 52, 44
80. 57 62 43 58 54 45 52 92
Draw up astem and leaf plot tO organise the data. and use it to calculate the mean and determine ie
median.
Key:
Stem Unordered Leaves Ordered Leaves
3 35 3
S 2 3 3 33
Mean:
Median:
Gr.9
Unit 11