APPENDIX TO CHAPTER 1
Working with Graphs
Number range NL1Teaching Objectives
The primary objective of this appendix is to show how to interpret and construct graphs. It
provides the groundwork for interpreting points on a graph as well as for explaining what causes
a graph to shift. It accomplishes this in three consecutive steps. First, it explains how to read
graphs. Second, it explains how to construct a graph. Third, it introduces the production
possibilities curve, a commonly used tool in economics, and offers a useful exercise employing
the example of gains from trade.
Unique features of this appendix include showing how graphs depict relationships between
variables, how to construct a graph from a table, and how to illustrate a shift in a curve due to a
variable not represented on the graph.
This is an important appendix given the relatively heavy usage of graphs throughout the text.
Number range NL1Key Terms
production possibilities curve (PPC)
Number range NL1Lecture Outline and Teaching Strategies
Number range NL1Constructing and Interpreting a Graph
Use the data in Figure 1.2 (demand schedule) to create and interpret a graph. Explain cause and
effect, and use the convention of price on the vertical and quantity on the horizontal axes. Draw
and explain a shift outward of the demand curve (Figure 1.3).
Teaching Strategy: Draw the Pythagorean Theorem and compare it to a demand curve, asking
the question: “What assumptions are made in the Pythagorean Theorem (right angle and linear
plane)?” By contrasting the two graphs, reinforce the concept that economics is not as exact as
mathematics because it is analyzing people behavior.
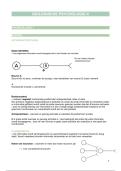
Production possibilities curve
The production possibilities curve describes the nature of social choices between
alternatives.
Teaching Strategy: The production possibilities curve is usually the first model that is
introduced in an economics course. Consequently, you should develop it carefully.
Interpreting points inside the production possibilities curve
, Note that points inside the production possibilities curve represent underutilized resources.
Interpreting points outside the production possibilities curve
Emphasize that points outside the production possibilities curve are attainable given the
resources of the economy.
Shifts of curves
The production possibilities curve (PPC) shifts if a country obtains more resources.
Teaching Strategy: Point out that the PPC can also shift when there is a technological
improvement that allows for a more efficient use of the nation’s resources.
Gains from trade
Trade occurs because individuals or countries find that it is mutually beneficial to specialize
in goods in which they have a comparative advantage and trade for other goods.
Teaching Strategy: Students usually have trouble with comparative advantage and trade.
This is not because the ideas are inherently hard to understand but because there is a lot of
which to keep track. Work through an example, and give them an example to work through
on their own. Emphasize that comparative advantage is the ability of one person or country
to do something with a lower opportunity cost than another, and specialization according to
comparative advantage followed by trade allows everyone to acquire more of the goods they
want.
Teaching Strategy: Ask your students why a professor who is good at repairing cars might
still prefer to take his automobile to a garage for a tune up.
Answers to Exercises
1Number range NL_a.
aNumber range NL_1_.
, Quantity sold when
the price is $550.
1,000
900
800
700
Price
600
500
400
300
200
100
0
200 400 600 800 1,000 1,200 1,400 1,600 1,800 2,000
Quantity Sold
bNumber range NL_1_. When the price is $550, the quantity sold is 1,100 units.
, cNumber range NL_1_.
600,000
500,000
400,000
Total Revenue
300,000
200,000 Total revenue when
the price is $550.
100,000
200 400 600 800 1,000 1,200 1,400 1,600 1,800 2,000
Quantity Sold
dNumber range NL_1_. When 1,100 units are sold, the total revenue is $605,000. There
will be no change in total revenue if the price is lowered between $550 and $500.
Total revenue will fall if the price is below $500.
2Number range NL_a. Number range NL_a
eNumber range NL_1_.
Haiti Cuba
1,000 1,000
Number of People Provided
Number of People Provided
Health Care
Health Care
500 500
0 0
0 7 10 0 3 7
Tons of Food Produced Tons of Food Produced
fNumber range NL_1_. Haiti has a comparative advantage in the production of health
care services. It gives up just 3 tons of food to provide 500 people with health care,
while Cuba gives up 7 tons of food to provide 500 people with health care.
Conversely, Cuba has a comparative advantage in food production. It gives up
Working with Graphs
Number range NL1Teaching Objectives
The primary objective of this appendix is to show how to interpret and construct graphs. It
provides the groundwork for interpreting points on a graph as well as for explaining what causes
a graph to shift. It accomplishes this in three consecutive steps. First, it explains how to read
graphs. Second, it explains how to construct a graph. Third, it introduces the production
possibilities curve, a commonly used tool in economics, and offers a useful exercise employing
the example of gains from trade.
Unique features of this appendix include showing how graphs depict relationships between
variables, how to construct a graph from a table, and how to illustrate a shift in a curve due to a
variable not represented on the graph.
This is an important appendix given the relatively heavy usage of graphs throughout the text.
Number range NL1Key Terms
production possibilities curve (PPC)
Number range NL1Lecture Outline and Teaching Strategies
Number range NL1Constructing and Interpreting a Graph
Use the data in Figure 1.2 (demand schedule) to create and interpret a graph. Explain cause and
effect, and use the convention of price on the vertical and quantity on the horizontal axes. Draw
and explain a shift outward of the demand curve (Figure 1.3).
Teaching Strategy: Draw the Pythagorean Theorem and compare it to a demand curve, asking
the question: “What assumptions are made in the Pythagorean Theorem (right angle and linear
plane)?” By contrasting the two graphs, reinforce the concept that economics is not as exact as
mathematics because it is analyzing people behavior.
Production possibilities curve
The production possibilities curve describes the nature of social choices between
alternatives.
Teaching Strategy: The production possibilities curve is usually the first model that is
introduced in an economics course. Consequently, you should develop it carefully.
Interpreting points inside the production possibilities curve
, Note that points inside the production possibilities curve represent underutilized resources.
Interpreting points outside the production possibilities curve
Emphasize that points outside the production possibilities curve are attainable given the
resources of the economy.
Shifts of curves
The production possibilities curve (PPC) shifts if a country obtains more resources.
Teaching Strategy: Point out that the PPC can also shift when there is a technological
improvement that allows for a more efficient use of the nation’s resources.
Gains from trade
Trade occurs because individuals or countries find that it is mutually beneficial to specialize
in goods in which they have a comparative advantage and trade for other goods.
Teaching Strategy: Students usually have trouble with comparative advantage and trade.
This is not because the ideas are inherently hard to understand but because there is a lot of
which to keep track. Work through an example, and give them an example to work through
on their own. Emphasize that comparative advantage is the ability of one person or country
to do something with a lower opportunity cost than another, and specialization according to
comparative advantage followed by trade allows everyone to acquire more of the goods they
want.
Teaching Strategy: Ask your students why a professor who is good at repairing cars might
still prefer to take his automobile to a garage for a tune up.
Answers to Exercises
1Number range NL_a.
aNumber range NL_1_.
, Quantity sold when
the price is $550.
1,000
900
800
700
Price
600
500
400
300
200
100
0
200 400 600 800 1,000 1,200 1,400 1,600 1,800 2,000
Quantity Sold
bNumber range NL_1_. When the price is $550, the quantity sold is 1,100 units.
, cNumber range NL_1_.
600,000
500,000
400,000
Total Revenue
300,000
200,000 Total revenue when
the price is $550.
100,000
200 400 600 800 1,000 1,200 1,400 1,600 1,800 2,000
Quantity Sold
dNumber range NL_1_. When 1,100 units are sold, the total revenue is $605,000. There
will be no change in total revenue if the price is lowered between $550 and $500.
Total revenue will fall if the price is below $500.
2Number range NL_a. Number range NL_a
eNumber range NL_1_.
Haiti Cuba
1,000 1,000
Number of People Provided
Number of People Provided
Health Care
Health Care
500 500
0 0
0 7 10 0 3 7
Tons of Food Produced Tons of Food Produced
fNumber range NL_1_. Haiti has a comparative advantage in the production of health
care services. It gives up just 3 tons of food to provide 500 people with health care,
while Cuba gives up 7 tons of food to provide 500 people with health care.
Conversely, Cuba has a comparative advantage in food production. It gives up