6.1. Summarizing possible outcomes and their
probabilities
Random variable = numerical measurement of the outcome of a random phenomenon. Often, the
randomness results from the use of random sampling or a randomized experiment to gather
the data.
- When referring to the random variable itself, rather than a particular value, we’ll use a
capital letter. Such as X.
o X = number of heads in three flips of a coin denotes the random variable
o x = 2 is one of its possible values, as is x=3 or x=0
- because a random variable refers to the outcome of a random phenomenon, each possible
outcome has a specific probability of occurring.
- The probability distribution of a random variable specifies its possible values and their
probabilities.
o An advantage of a variable being a random variable is that it’s possible to specify
such probabilities. Without randomness, we would not be able to predict the
probabilities of the possible outcomes in the long run.
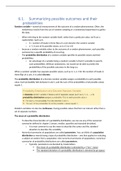
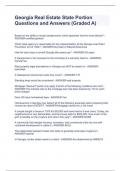
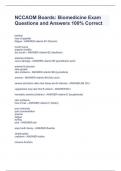
When a random variable has separate possible values, such as 0, 1, 2, 3 for the number of heads in
three flips of a coin, it is called discrete.
The probability distribution of a discrete random variable assigns a probability to each possible
value. Each probability falls between 0 and 1, and the sum of the probabilities of all possible values
equals 1.
Random variables can also be continuous, having possible values that form an interval rather than a
set of separate numbers.
The mean of a probability distribution
- To describe characteristics of a probability distribution, we can use any of the numerical
summaries defined in chapter 2 (mean, median, quartiles and standard deviation).
o It is most common to use the mean to describe the center and the standard
deviation to describe the variability.
- Numerical summaries of populations are called parameters. You can think of a population
distribution as merely being a type of probability distribution – one that applies for selecting
a subject at random from a population. Like numerical summaries of populations, numerical
summaries of probability distributions are called parameters.
o Typically, parameters are denoted by Greek letters.
The mean of a probability distribution is denoted by μ (“mu”- mew)
The standard deviation of a probability distribution is denoted by 𝜎 (sigma)
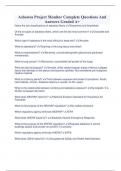
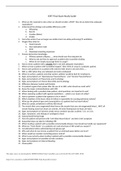
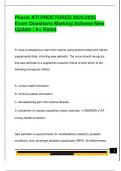
, - The mean of a probability distribution for a discrete random variable is μ=Σ x × P( x),
where the sum is taken over all possible values of x.
o Each possible value of x is multiplied by its probability P(x) and is then added up.
The mean μ=Σ x × P(x) is called the weighted average: values of x that are more likely, receive
greater weight P(x).
- This formula for the mean of a probability distribution generalized the ordinary formula for
the mean, to allow for outcomes that are not equally likely.
- The mean μ of the probability distribution of a random variable X is also called the expected
value of X.
o The expected value reflects not what we’ll observe in a single observation, but
rather what we expect for the average in a long run of observations.
Summarizing the variability of a probability distribution
- The standard deviation of a probability distribution, denoted by σ , measures the variability
from the mean.
o Larger values for σ correspond to greater variability.
o Roughly, σ describes how far values of the random variable fall, on the average,
from the expected value of the distribution.
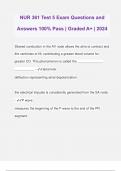
Probability distributions of categorical variables
- A random variable is defined to be a numerical measurement of the outcome of a random
phenomenon. However, for categorical variables having only two categories, it’s often useful
to represent the two possible outcomes by the numerical values 0 and 1.
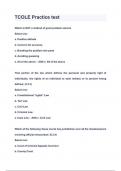
o The mean is equal to the probability of success. For random variables that have
possible values 0 and 1, the mean is the probability of the outcome coded as 1.
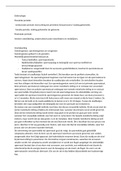
Probability distributions of continuous random variables
- A random variable is called continuous when its possible values form an interval.
- Probability distributions of continuous random variables assign probabilities to any interval
of the possible values.
- The probability that a random variable falls in any particular interval is between 0 and 1 and
the probability of the interval that contains all the possible values equals 1.
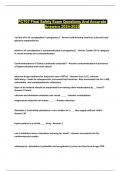
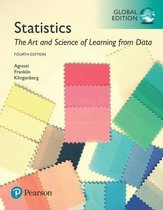
- As the number of intervals increases, with their width narrowing, the shape of the histogram
gradually approaches a smooth curve.
probabilities
Random variable = numerical measurement of the outcome of a random phenomenon. Often, the
randomness results from the use of random sampling or a randomized experiment to gather
the data.
- When referring to the random variable itself, rather than a particular value, we’ll use a
capital letter. Such as X.
o X = number of heads in three flips of a coin denotes the random variable
o x = 2 is one of its possible values, as is x=3 or x=0
- because a random variable refers to the outcome of a random phenomenon, each possible
outcome has a specific probability of occurring.
- The probability distribution of a random variable specifies its possible values and their
probabilities.
o An advantage of a variable being a random variable is that it’s possible to specify
such probabilities. Without randomness, we would not be able to predict the
probabilities of the possible outcomes in the long run.
When a random variable has separate possible values, such as 0, 1, 2, 3 for the number of heads in
three flips of a coin, it is called discrete.
The probability distribution of a discrete random variable assigns a probability to each possible
value. Each probability falls between 0 and 1, and the sum of the probabilities of all possible values
equals 1.
Random variables can also be continuous, having possible values that form an interval rather than a
set of separate numbers.
The mean of a probability distribution
- To describe characteristics of a probability distribution, we can use any of the numerical
summaries defined in chapter 2 (mean, median, quartiles and standard deviation).
o It is most common to use the mean to describe the center and the standard
deviation to describe the variability.
- Numerical summaries of populations are called parameters. You can think of a population
distribution as merely being a type of probability distribution – one that applies for selecting
a subject at random from a population. Like numerical summaries of populations, numerical
summaries of probability distributions are called parameters.
o Typically, parameters are denoted by Greek letters.
The mean of a probability distribution is denoted by μ (“mu”- mew)
The standard deviation of a probability distribution is denoted by 𝜎 (sigma)
, - The mean of a probability distribution for a discrete random variable is μ=Σ x × P( x),
where the sum is taken over all possible values of x.
o Each possible value of x is multiplied by its probability P(x) and is then added up.
The mean μ=Σ x × P(x) is called the weighted average: values of x that are more likely, receive
greater weight P(x).
- This formula for the mean of a probability distribution generalized the ordinary formula for
the mean, to allow for outcomes that are not equally likely.
- The mean μ of the probability distribution of a random variable X is also called the expected
value of X.
o The expected value reflects not what we’ll observe in a single observation, but
rather what we expect for the average in a long run of observations.
Summarizing the variability of a probability distribution
- The standard deviation of a probability distribution, denoted by σ , measures the variability
from the mean.
o Larger values for σ correspond to greater variability.
o Roughly, σ describes how far values of the random variable fall, on the average,
from the expected value of the distribution.
Probability distributions of categorical variables
- A random variable is defined to be a numerical measurement of the outcome of a random
phenomenon. However, for categorical variables having only two categories, it’s often useful
to represent the two possible outcomes by the numerical values 0 and 1.
o The mean is equal to the probability of success. For random variables that have
possible values 0 and 1, the mean is the probability of the outcome coded as 1.
Probability distributions of continuous random variables
- A random variable is called continuous when its possible values form an interval.
- Probability distributions of continuous random variables assign probabilities to any interval
of the possible values.
- The probability that a random variable falls in any particular interval is between 0 and 1 and
the probability of the interval that contains all the possible values equals 1.
- As the number of intervals increases, with their width narrowing, the shape of the histogram
gradually approaches a smooth curve.