,Introduction to Econometrics, 4e (Stock/Watson)
Chapter 1 Economic Questions and Data
1.1 Multiple Choice Questions
1) Analyzing the behavior of unemployment rates across U.S. states in March of 2006 is an
example of using:
A) time series data.
B) panel data.
C) cross-sectional data.
D) experimental data.
Answer: C
2) Studying inflation in the United States from 1970 to 2006 is an example of using:
A) randomized controlled experiments.
B) time series data.
C) panel data.
D) cross-sectional data.
Answer: B
3) Analyzing the effect of minimum wage changes on teenage employment across the 48
contiguous U.S. states from 1980 to 2004 is an example of using:
A) time series data.
B) panel data.
C) having a treatment group vs. a control group, since only teenagers receive minimum wages.
D) cross-sectional data.
Answer: B
4) Panel data:
A) is also called longitudinal data.
B) is the same as time series data.
C) studies a group of people at a point in time.
D) typically uses control and treatment groups.
Answer: A
5) Econometrics can be defined as follows with the exception of:
A) the science of testing economic theory.
B) fitting mathematical economic models to real-world data.
C) a set of tools used for forecasting future values of economic variables.
D) measuring the height of economists.
Answer: D
,6) To provide quantitative answers to policy questions:
A) it is typically sufficient to use common sense.
B) you should interview the policy makers involved.
C) you should examine empirical evidence.
D) is typically impossible since policy questions are not quantifiable.
Answer: C
7) An example of a randomized controlled experiment is when:
A) households receive a tax rebate in one year but not the other.
B) one U.S. state increases minimum wages and an adjacent state does not, and employment
differences are observed.
C) random variables are controlled for by holding constant other factors.
D) some 5th graders in a specific elementary school are allowed to use computers at school
while others are not, and their end-of-year performance is compared holding constant other
factors.
Answer: D
8) Ideal randomized controlled experiments in economics are:
A) often performed in practice.
B) often used by the Federal Reserve to study the effects of monetary policy.
C) useful because they give a definition of a causal effect.
D) sometimes used by universities to determine who graduates in four years rather than five.
Answer: C
9) Most economic data are obtained:
A) through randomized controlled experiments.
B) by calibration methods.
C) through textbook examples typically involving ten observation points.
D) by observing real-world behavior.
Answer: D
10) One of the primary advantages of using econometrics over typical results from economic
theory, is that:
A) it potentially provides you with quantitative answers for a policy problem rather than simply
suggesting the direction (positive/negative) of the response.
B) teaching you how to use statistical packages
C) learning how to invert a 4 by 4 matrix.
D) all of the above.
Answer: A
11) In a randomized controlled experiment:
A) there is a control group and a treatment group.
B) you control for the effect that random numbers are not truly randomly generated
C) you control for random answers
D) the control group receives treatment on even days only.
Answer: A
2
Copyright © 2019 Pearson Education, Inc.
, 12) The reason why economists do not use experimental data more frequently is for all of the
following reasons EXCEPT that real-world experiments:
A) cannot be executed in economics.
B) with humans are difficult to administer.
C) are often unethical.
D) have flaws relative to ideal randomized controlled experiments.
Answer: A
13) The most frequently used experimental or observational data in econometrics are of the
following type:
A) cross-sectional data.
B) randomly generated data.
C) time series data.
D) panel data.
Answer: A
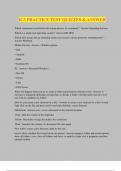
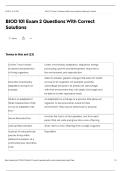
14) In the graph below, the vertical axis represents average real GDP growth for 65 countries
over the period 1960-1995, and the horizontal axis shows the average trade share within these
countries.
This is an example of:
A) cross-sectional data.
B) experimental data.
C) a time series.
D) longitudinal data.
Answer: A
3
Copyright © 2019 Pearson Education, Inc.
Chapter 1 Economic Questions and Data
1.1 Multiple Choice Questions
1) Analyzing the behavior of unemployment rates across U.S. states in March of 2006 is an
example of using:
A) time series data.
B) panel data.
C) cross-sectional data.
D) experimental data.
Answer: C
2) Studying inflation in the United States from 1970 to 2006 is an example of using:
A) randomized controlled experiments.
B) time series data.
C) panel data.
D) cross-sectional data.
Answer: B
3) Analyzing the effect of minimum wage changes on teenage employment across the 48
contiguous U.S. states from 1980 to 2004 is an example of using:
A) time series data.
B) panel data.
C) having a treatment group vs. a control group, since only teenagers receive minimum wages.
D) cross-sectional data.
Answer: B
4) Panel data:
A) is also called longitudinal data.
B) is the same as time series data.
C) studies a group of people at a point in time.
D) typically uses control and treatment groups.
Answer: A
5) Econometrics can be defined as follows with the exception of:
A) the science of testing economic theory.
B) fitting mathematical economic models to real-world data.
C) a set of tools used for forecasting future values of economic variables.
D) measuring the height of economists.
Answer: D
,6) To provide quantitative answers to policy questions:
A) it is typically sufficient to use common sense.
B) you should interview the policy makers involved.
C) you should examine empirical evidence.
D) is typically impossible since policy questions are not quantifiable.
Answer: C
7) An example of a randomized controlled experiment is when:
A) households receive a tax rebate in one year but not the other.
B) one U.S. state increases minimum wages and an adjacent state does not, and employment
differences are observed.
C) random variables are controlled for by holding constant other factors.
D) some 5th graders in a specific elementary school are allowed to use computers at school
while others are not, and their end-of-year performance is compared holding constant other
factors.
Answer: D
8) Ideal randomized controlled experiments in economics are:
A) often performed in practice.
B) often used by the Federal Reserve to study the effects of monetary policy.
C) useful because they give a definition of a causal effect.
D) sometimes used by universities to determine who graduates in four years rather than five.
Answer: C
9) Most economic data are obtained:
A) through randomized controlled experiments.
B) by calibration methods.
C) through textbook examples typically involving ten observation points.
D) by observing real-world behavior.
Answer: D
10) One of the primary advantages of using econometrics over typical results from economic
theory, is that:
A) it potentially provides you with quantitative answers for a policy problem rather than simply
suggesting the direction (positive/negative) of the response.
B) teaching you how to use statistical packages
C) learning how to invert a 4 by 4 matrix.
D) all of the above.
Answer: A
11) In a randomized controlled experiment:
A) there is a control group and a treatment group.
B) you control for the effect that random numbers are not truly randomly generated
C) you control for random answers
D) the control group receives treatment on even days only.
Answer: A
2
Copyright © 2019 Pearson Education, Inc.
, 12) The reason why economists do not use experimental data more frequently is for all of the
following reasons EXCEPT that real-world experiments:
A) cannot be executed in economics.
B) with humans are difficult to administer.
C) are often unethical.
D) have flaws relative to ideal randomized controlled experiments.
Answer: A
13) The most frequently used experimental or observational data in econometrics are of the
following type:
A) cross-sectional data.
B) randomly generated data.
C) time series data.
D) panel data.
Answer: A
14) In the graph below, the vertical axis represents average real GDP growth for 65 countries
over the period 1960-1995, and the horizontal axis shows the average trade share within these
countries.
This is an example of:
A) cross-sectional data.
B) experimental data.
C) a time series.
D) longitudinal data.
Answer: A
3
Copyright © 2019 Pearson Education, Inc.