Stat 431 Assignment 3 solutions
1. [ 12 marks]
(a) We start by fitting the interaction model
!
st
logit(πi ) = β0 + β1 xi1 + β2 xi2 + β3 xi1 xi2
po
The Wald-test for H0 : β3 (coefficient of interaction term) gives a p − value << 0.05,
hence we can not drop the interaction term. Since we can not further simplify this
model, it is the best logit model we can fit. [2]
t
no
cells<-read.table("cells.txt", header=T)
cells$resp<-cbind(cells$Cell, 200-cells$Cell)
fit1<-glm(resp~tnf+ifn+tnf*ifn, family=binomial, data=cells)
o
> summary(fit1)
D
Call:
glm(formula = resp ~ tnf + ifn + tnf * ifn, family = binomial,
-
data = cells)
ht
Deviance Residuals:
Min 1Q Median 3Q Max
-5.2331 -3.4359 -0.7136 2.8511 4.8272
ig
yr
Coefficients:
Estimate Std. Error z value Pr(>|z|)
(Intercept) -1.730e+00 7.055e-02 -24.524 < 2e-16 ***
op
tnf 2.521e-02 1.353e-03 18.625 < 2e-16 ***
ifn 1.068e-02 1.213e-03 8.798 < 2e-16 ***
tnf:ifn 3.839e-04 8.499e-05 4.517 6.26e-06 ***
C
---
Signif. codes: 0 ?***? 0.001 ?**? 0.01 ?*? 0.05 ?.? 0.1 ? ? 1
e
(Dispersion parameter for binomial family taken to be 1)
th
Null deviance: 1309.96 on 15 degrees of freedom
Residual deviance: 192.36 on 12 degrees of freedom
ns
AIC: 281.84
ow
However, the deviance test indicate that this model is not adequate (compared to
the saturated model).
r
Interpretation [4]
to
• exp(βb0 ) = 0.1772844: odds of response when both TNF dose xi1 = 0 and IFN
c
dose xi2 = 0. This odds is < 1, which means the probability of cell differentiation
ru
is very low (compared to no cell differentiation).
• β2 is the change in the log odds of cell differentiation associated with 1 unit
st
of increase in IFN, when TNF dose xi1 = 0. As βb2 = 1.068, the log odds (or
In
the probability) of cell differentiation increase as IFN dose increases, when TNF
dose is zero.
• When the dose of TNF (xi1 ) increase by 1 unit, the log odds of response change
by β1 + β3 xi2 , which is a linear function of IFN dose (xi2 ).
– βb1 = 2.521 is the amount of increase in log odds due to 1 unit of increase in
TNF, when IFN dose xi2 = 0.
1
, – We see that βb3 = 3.839 (the slope of the change in log odds), it means
that the higher the dose of IFN, the bigger the increase in log odds of cell
differentiation due to the increase of TNF dose.
In summary, the significant positive effect of interaction term β3 implies
that, the higher the TNF dose, the stronger the impact of IFN dose on the
probability of cell differentiation, and vice versa.
!
st
• Similarly when the dose of IFN dose (xi2 ) increase by 1 unit, the log odds of
po
response change by β2 + β3 xi1 , which is a linear function of TNF dose (xi1 ).
– βb2 = 1.068 is the amount of increase in log odds due to 1 unit of increase in
t
IFN, when TNF dose xi1 = 0.
no
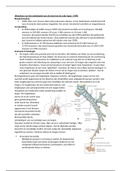
(b) Deviance residuals plots demonstrate the poor fit of the selected logistic model in
(a), which agrees with the Deviance test result. [2]
o
D
-
ht
5
5
5
DEVIANCE RESIDUALS
DEVIANCE RESIDUALS
DEVIANCE RESIDUALS
ig
0
0
0
yr
op
-5
-5
-5
C
0 20 40 60 80 100 0 20 40 60 80 100 0.2 0.4 0.6 0.8 1.0
TNF dose IFN dose FITTED VALUE
e
th
rd <- residuals.glm(fit1,"deviance")
fv <- fit1$fitted.values
ns
par(mfrow=c(1, 3))
plot(cells$tnf, rd,ylim=c(-8,8), xlab="TNF dose",ylab="DEVIANCE RESIDUALS")
abline(h=-2); abline(h= 2)
ow
plot(cells$ifn, rd,ylim=c(-8,8), xlab="IFN dose",ylab="DEVIANCE RESIDUALS")
abline(h=-2); abline(h= 2)
plot(fv, rd,ylim=c(-8,8), xlab="FITTED VALUE",ylab="DEVIANCE RESIDUALS")
abline(h=-2); abline(h= 2)
r
to
(c) The best fitted cloglog model is the main effects model [2]
c
log(− log(1 − πi )) = β0 + β1 xi1 + β2 xi2
ru
However, changing to cloglog link seems do not improve the fit at all, and the residual
st
plots are equally bad as the logit model. [2]
In
2
1. [ 12 marks]
(a) We start by fitting the interaction model
!
st
logit(πi ) = β0 + β1 xi1 + β2 xi2 + β3 xi1 xi2
po
The Wald-test for H0 : β3 (coefficient of interaction term) gives a p − value << 0.05,
hence we can not drop the interaction term. Since we can not further simplify this
model, it is the best logit model we can fit. [2]
t
no
cells<-read.table("cells.txt", header=T)
cells$resp<-cbind(cells$Cell, 200-cells$Cell)
fit1<-glm(resp~tnf+ifn+tnf*ifn, family=binomial, data=cells)
o
> summary(fit1)
D
Call:
glm(formula = resp ~ tnf + ifn + tnf * ifn, family = binomial,
-
data = cells)
ht
Deviance Residuals:
Min 1Q Median 3Q Max
-5.2331 -3.4359 -0.7136 2.8511 4.8272
ig
yr
Coefficients:
Estimate Std. Error z value Pr(>|z|)
(Intercept) -1.730e+00 7.055e-02 -24.524 < 2e-16 ***
op
tnf 2.521e-02 1.353e-03 18.625 < 2e-16 ***
ifn 1.068e-02 1.213e-03 8.798 < 2e-16 ***
tnf:ifn 3.839e-04 8.499e-05 4.517 6.26e-06 ***
C
---
Signif. codes: 0 ?***? 0.001 ?**? 0.01 ?*? 0.05 ?.? 0.1 ? ? 1
e
(Dispersion parameter for binomial family taken to be 1)
th
Null deviance: 1309.96 on 15 degrees of freedom
Residual deviance: 192.36 on 12 degrees of freedom
ns
AIC: 281.84
ow
However, the deviance test indicate that this model is not adequate (compared to
the saturated model).
r
Interpretation [4]
to
• exp(βb0 ) = 0.1772844: odds of response when both TNF dose xi1 = 0 and IFN
c
dose xi2 = 0. This odds is < 1, which means the probability of cell differentiation
ru
is very low (compared to no cell differentiation).
• β2 is the change in the log odds of cell differentiation associated with 1 unit
st
of increase in IFN, when TNF dose xi1 = 0. As βb2 = 1.068, the log odds (or
In
the probability) of cell differentiation increase as IFN dose increases, when TNF
dose is zero.
• When the dose of TNF (xi1 ) increase by 1 unit, the log odds of response change
by β1 + β3 xi2 , which is a linear function of IFN dose (xi2 ).
– βb1 = 2.521 is the amount of increase in log odds due to 1 unit of increase in
TNF, when IFN dose xi2 = 0.
1
, – We see that βb3 = 3.839 (the slope of the change in log odds), it means
that the higher the dose of IFN, the bigger the increase in log odds of cell
differentiation due to the increase of TNF dose.
In summary, the significant positive effect of interaction term β3 implies
that, the higher the TNF dose, the stronger the impact of IFN dose on the
probability of cell differentiation, and vice versa.
!
st
• Similarly when the dose of IFN dose (xi2 ) increase by 1 unit, the log odds of
po
response change by β2 + β3 xi1 , which is a linear function of TNF dose (xi1 ).
– βb2 = 1.068 is the amount of increase in log odds due to 1 unit of increase in
t
IFN, when TNF dose xi1 = 0.
no
(b) Deviance residuals plots demonstrate the poor fit of the selected logistic model in
(a), which agrees with the Deviance test result. [2]
o
D
-
ht
5
5
5
DEVIANCE RESIDUALS
DEVIANCE RESIDUALS
DEVIANCE RESIDUALS
ig
0
0
0
yr
op
-5
-5
-5
C
0 20 40 60 80 100 0 20 40 60 80 100 0.2 0.4 0.6 0.8 1.0
TNF dose IFN dose FITTED VALUE
e
th
rd <- residuals.glm(fit1,"deviance")
fv <- fit1$fitted.values
ns
par(mfrow=c(1, 3))
plot(cells$tnf, rd,ylim=c(-8,8), xlab="TNF dose",ylab="DEVIANCE RESIDUALS")
abline(h=-2); abline(h= 2)
ow
plot(cells$ifn, rd,ylim=c(-8,8), xlab="IFN dose",ylab="DEVIANCE RESIDUALS")
abline(h=-2); abline(h= 2)
plot(fv, rd,ylim=c(-8,8), xlab="FITTED VALUE",ylab="DEVIANCE RESIDUALS")
abline(h=-2); abline(h= 2)
r
to
(c) The best fitted cloglog model is the main effects model [2]
c
log(− log(1 − πi )) = β0 + β1 xi1 + β2 xi2
ru
However, changing to cloglog link seems do not improve the fit at all, and the residual
st
plots are equally bad as the logit model. [2]
In
2