Summary MRM BA 1
Lecture 1
Data has a fixed structure. It consists of a number of properties (variables) each column
represents one variable.
Measured from a set of things/people/etc (units) each row represents one unit.
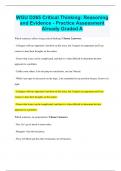
Levels of measurement:
1. Categorical (entities are divided into distinct
categories):
Binary variable (two outcomes), e.g.
dead or alive.
Nominal variable, e.g. whether
someone is an omnivore, vegetarian
or vegan.
Ordinal variable, e.g. bad,
intermediate, good.
2. Numerical:
Discrete data (counts), e.g.: number of defects.
Continuous (entities get a distinct score), e.g. temperature, body length.
Variables can be converted to a lower level of measurement. For example, from:
- Body length ≤ 160cm → small
- Body length > 160cm and < 180cm →normal
- Body length ≥ 180cm → tall
This implies a loss of information. It is not reversible. For example, if you know that “body length =
normal”, the exact amount of cm’s cannot be retrieved (herwinnen).
The lower the amount of information in your data, the larger your sample needs to be.
1
,In quantitative research, you need to motivate and document the way you collected data:
- Is the sample representative?
- Is the data valid?
- Is there measurement error?
Is the sample representative? Generalize findings in a sample to an entire population.
- Measure firm’s revenue for 3 weeks generalize to the full 52 weeks.
- Measure outside temperature for 5 days generalize to the entire month.
- Ask 1000 people who they will vote on at the elections predict outcome of entire country.
Representativeness: statistics only gives conclusions about the population you have sampled from.
- Measure firm’s revenue for 3 weeks in October conclusions not valid for July.
- Measure outside temperature for 5 days in September conclusions not valid for whole
year.
- Ask 1000 people at Woodstock who they’ll vote on probably not representative for
election results.
Questions to ask:
- What is the population?
- How to make my sample representative for that population?
Usually random sampling:
- Assign numbers to all units in the population.
- Let a computer draw randomly 30 numbers.
- Include these observations in your sample.
Validity: Do the data reflect what they should reflect? And can they be used to answer the research
question?
- Data should be checked for errors and mistakes (“face validity check”).
- Multiple people involved in measurement: did everybody know the measurement
procedure?
- Were there other problems / irregularities during measurement?
Measurement error: the discrepancy (verschil) between the actual value we are trying to measure,
and the number we use to represent that value. Example: you (in reality) weigh 80 kg. According to
your bathroom scale, you weigh 83 kg. The measurement error is 3 kg.
2
,! There are two types of measurement error:
1. Systematic: difference between the average measurement result and the true value. E.g.:
clocks on mobile phones are regularly synchronised with online time servers.
2. Random: unsystematic deviations (afwijkingen) due to imprecision of the measurement
system. E.g.: for ice skating at the winter olympics, multiple time measurement systems are
used to decide who is the winner.
Difference systematic error and bias Bias general name so it’s the same.
Describing data: you usually do not recite (opsommen) an entire dataset when someone asks you
what is in it. You summarize it in a few numbers.
Median: the middle score when data is ordered. More robust against outliers in stead of the mean.
Mean: the sum of the data divided by the amount of data. This is meant by the average in statistics.
Question: what does a mean lower than median indicate? A significant discrepancy between the
median and the mean, in which the mean is lower than the median, indicates negative skewness in
the data.
Range: the smallest value subtracted from the largest. This is very sensitive to outliers.
Interquartile range: the range of the middle 50% of the data.
Variance: the average squared distance between each point and the mean of the data.
Standard deviation: the square root of the variance.
Question: why is the standard deviation preferred over the variance as the metric for dispersion to
report in analyses? Because the standard deviation is easier to interpret than the variance as it has
the same measurement unit as the variable
under consideration.
3
, dispersion = spreiding
Confidence interval:
- When we estimate something (mean, standard deviation, correlation, etc.), we make
sampling error (a different sample will contain different estimates).
- Which means: X ≠ 𝜇 in general.
- However: X will be close to or around 𝜇.
- Specifically, in 95% of cases, we will find X such that
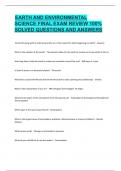
Skew:
- The asymmetry of the distribution
- Positive skew (scores bunched at low values with the tail pointing to high values).
- Negative skew (scores bunched at high values with the tail pointing to low values).
Mode: the most frequent score
Bimodal: having two modes
Multimodal: having several modes
4
Lecture 1
Data has a fixed structure. It consists of a number of properties (variables) each column
represents one variable.
Measured from a set of things/people/etc (units) each row represents one unit.
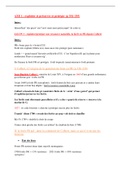
Levels of measurement:
1. Categorical (entities are divided into distinct
categories):
Binary variable (two outcomes), e.g.
dead or alive.
Nominal variable, e.g. whether
someone is an omnivore, vegetarian
or vegan.
Ordinal variable, e.g. bad,
intermediate, good.
2. Numerical:
Discrete data (counts), e.g.: number of defects.
Continuous (entities get a distinct score), e.g. temperature, body length.
Variables can be converted to a lower level of measurement. For example, from:
- Body length ≤ 160cm → small
- Body length > 160cm and < 180cm →normal
- Body length ≥ 180cm → tall
This implies a loss of information. It is not reversible. For example, if you know that “body length =
normal”, the exact amount of cm’s cannot be retrieved (herwinnen).
The lower the amount of information in your data, the larger your sample needs to be.
1
,In quantitative research, you need to motivate and document the way you collected data:
- Is the sample representative?
- Is the data valid?
- Is there measurement error?
Is the sample representative? Generalize findings in a sample to an entire population.
- Measure firm’s revenue for 3 weeks generalize to the full 52 weeks.
- Measure outside temperature for 5 days generalize to the entire month.
- Ask 1000 people who they will vote on at the elections predict outcome of entire country.
Representativeness: statistics only gives conclusions about the population you have sampled from.
- Measure firm’s revenue for 3 weeks in October conclusions not valid for July.
- Measure outside temperature for 5 days in September conclusions not valid for whole
year.
- Ask 1000 people at Woodstock who they’ll vote on probably not representative for
election results.
Questions to ask:
- What is the population?
- How to make my sample representative for that population?
Usually random sampling:
- Assign numbers to all units in the population.
- Let a computer draw randomly 30 numbers.
- Include these observations in your sample.
Validity: Do the data reflect what they should reflect? And can they be used to answer the research
question?
- Data should be checked for errors and mistakes (“face validity check”).
- Multiple people involved in measurement: did everybody know the measurement
procedure?
- Were there other problems / irregularities during measurement?
Measurement error: the discrepancy (verschil) between the actual value we are trying to measure,
and the number we use to represent that value. Example: you (in reality) weigh 80 kg. According to
your bathroom scale, you weigh 83 kg. The measurement error is 3 kg.
2
,! There are two types of measurement error:
1. Systematic: difference between the average measurement result and the true value. E.g.:
clocks on mobile phones are regularly synchronised with online time servers.
2. Random: unsystematic deviations (afwijkingen) due to imprecision of the measurement
system. E.g.: for ice skating at the winter olympics, multiple time measurement systems are
used to decide who is the winner.
Difference systematic error and bias Bias general name so it’s the same.
Describing data: you usually do not recite (opsommen) an entire dataset when someone asks you
what is in it. You summarize it in a few numbers.
Median: the middle score when data is ordered. More robust against outliers in stead of the mean.
Mean: the sum of the data divided by the amount of data. This is meant by the average in statistics.
Question: what does a mean lower than median indicate? A significant discrepancy between the
median and the mean, in which the mean is lower than the median, indicates negative skewness in
the data.
Range: the smallest value subtracted from the largest. This is very sensitive to outliers.
Interquartile range: the range of the middle 50% of the data.
Variance: the average squared distance between each point and the mean of the data.
Standard deviation: the square root of the variance.
Question: why is the standard deviation preferred over the variance as the metric for dispersion to
report in analyses? Because the standard deviation is easier to interpret than the variance as it has
the same measurement unit as the variable
under consideration.
3
, dispersion = spreiding
Confidence interval:
- When we estimate something (mean, standard deviation, correlation, etc.), we make
sampling error (a different sample will contain different estimates).
- Which means: X ≠ 𝜇 in general.
- However: X will be close to or around 𝜇.
- Specifically, in 95% of cases, we will find X such that
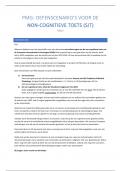
Skew:
- The asymmetry of the distribution
- Positive skew (scores bunched at low values with the tail pointing to high values).
- Negative skew (scores bunched at high values with the tail pointing to low values).
Mode: the most frequent score
Bimodal: having two modes
Multimodal: having several modes
4