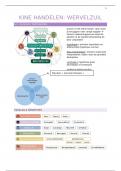
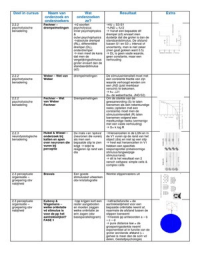
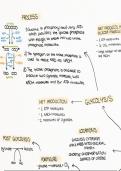
Ratio analysis
Comparison between different pieces of data
Liquidity ratio
How liquid (profitable) a business is.
Shows for every £1 that a business owes and how much liquid stock does it have.
£50,000 owed but have liquid stock £10,000, not good
Liquidity ratio – current ratio = current assets/current liabilities add up all current assets and
liabilities and then you have a liquidity ratio. How solvent is the business?
Liquidity ratio – acid test = current assets – inventory / current liabilities
Current assets = buildings etc. Inventory = stock. Current liabilities = things have to pay off right now
Number is lower than one, the company is not in a good place, above 1 then good.
(Applies to all ratios)
Gross profit margin = profitability ratio
= Net sales – cost of goods sold / net sales
Performance ratio – measures how well a business turns its assets
into revenue
Fixed asset turnover = revenue/value of property, plant, and equipment (fixed assets)
Sales revenue per employee = total sales revenue / total number of employees
Interpreting ratios
Some are compared against a pound (below one bad, above one good)
Some are compared against themselves and just give a clearer interpretation of data (ratio of size of
business vs staff) Sq. M of space / member of staff to see how much space for each member of staff.
Threats and “what if” scenarios
- SWOT
- What if? – what if something goes wrong?
- PESTLE