Week 1
Pairs of variables (Chapter 5)
Intro:
•Statistics and business decisions
•Forecasts and/or their verification needed:
•costs of inputs (electricity, raw materials, ...)
•profit forecast of a company
•expected wage
•First-year course: estimation and inference for a single variable
•The above quantities often depend on other factors/quantities (they control it by them self)
•costs depend on the demand and supply
•profit on the competition, margins, advertisement, ...
•wage on a person’s qualification, field of industry, ...
•This course: Interest in relating two or more measures/variables with each other
Motivation:
Examples – relationships between:
•Y= ‘weekly sales (€) of a clothing shop’ and
X= ‘weekly amount (€) spent on ads’
•Y= ‘weekly sales (units, €) of an ebook’ and
X= ‘price (€) of the ebook’ (is in control of the company)
•Y = ‘hourly wage of an employee’ and
X= ‘attained education level’
•Y= ‘productivity of a worker’ and
X= ‘number of months of experience of that worker’
•Y= ‘final grade of a student for this course’ and
X= ‘number of lectures/tutorials visited’
•Y= ‘weekly return of share Microsoft’ and
X = ‘weekly return of the Dow Jones stock index’
•.......
Introduction:
,Case: Relationship of the ebook sales ($) and the ebook pricing ($) published and sold by Amazon;
Period: January 2016; ebooks sold above 1000 pieces per day
Amazon is a (e)bookseller, but also an ebook publisher
Is the number of sold ebooks independent of their price?
Relation: Y = the number of sold ebooks, X = ebook price
Do the dollar sales of ebooks depend on their price?
Relation: Y = the dollar sales of ebook, X = ebook price
Which of the two quantiles is more price-sensitive?
Dataset: AmazonSales.sav (to be continued)
5.1 Scatter plot, Covariance and Correlation
Quantitative variables X and Y
, Questions:
-Are the y-data related to the corresponding x-data?
-Is it a linear relationship, that is, do the pairs of observations concentrate around a straight line?
-What is the degree (strength) of that linear relationship?
Objectives:
-Construct a plot visually relating the y-data and x-data.
-Find measures of association that measure the strength of the linear relationship.
Scatter plot: plot that depicts the pairs (xi, yi)
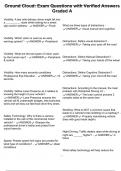
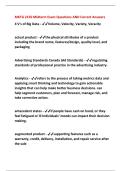
In the first graph, the points are close to the line. This means that the line approximates the
increasing relationship very well. In the second graph, the point are further removed from the line.
This means that the doesn’t approximate the decreasing relationship very well. In the third graph,
the mountain-shaped line implies that the growth is stagnating. A linear relationship (black line)
might not be the right form of dependence. Regarding the data, you have to determine which
relationship fits best. In the fourth graph there is a little positive relationship: the more GNI per
capita, the more happiness (it’s very hard to say what for relationship it is looking to the data)
General objectives:
-Single variable X: how can we measure/quantify the location and variation? Does it generalize to
multiple variables Y and X?
what we want to study: how strongly are X and Y related to each other? How much moves Y if X
changes? For that, we first have to find…. (see next line!)
-First, measures of association of Y and X are studied; covariance and correlation
-Later, study the variation of a variable Y
-Explain this variation by the dependence of Yon some other variable X.
[EbookCase: dependence of sales Yon price X]
-Consider regression of Y on X with
Y being the dependent variable and
X being the independent variable.
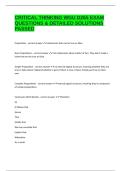
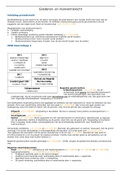
, Covariance:
interpretation: the higher the sales (x-axis), the higher the profits (y-axis). Area 1 is above both
averages, area 3 is under both averages. A positive relationship implies high sales in 1, low sales in 3.
If I compute in area 1 or 3, both quadrants have a positive (area 1) or a negative (area 3) sign. The
product of these both positive or negative sign give > 0. In area 2 and 4, one quadrant is either
positive or negative so the product is < 0.
Definitions of covariance: (can be faster and more handy then scatter plots!)
Sample dataset:
sample covariance
Population dataset:
population covariance
Remarks:
-notice the different notations (sample: Latin letters, population: Greek letters)
-sXY is often used as an estimate of the unknown XY
-division by n–1 leads generally to better estimates
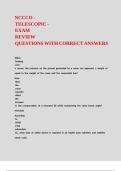
see 1: both quadrants are
positive, so this
observation is in 1. See 3:
both observations are
negative, so the
observation is in 3. Etc..
Pairs of variables (Chapter 5)
Intro:
•Statistics and business decisions
•Forecasts and/or their verification needed:
•costs of inputs (electricity, raw materials, ...)
•profit forecast of a company
•expected wage
•First-year course: estimation and inference for a single variable
•The above quantities often depend on other factors/quantities (they control it by them self)
•costs depend on the demand and supply
•profit on the competition, margins, advertisement, ...
•wage on a person’s qualification, field of industry, ...
•This course: Interest in relating two or more measures/variables with each other
Motivation:
Examples – relationships between:
•Y= ‘weekly sales (€) of a clothing shop’ and
X= ‘weekly amount (€) spent on ads’
•Y= ‘weekly sales (units, €) of an ebook’ and
X= ‘price (€) of the ebook’ (is in control of the company)
•Y = ‘hourly wage of an employee’ and
X= ‘attained education level’
•Y= ‘productivity of a worker’ and
X= ‘number of months of experience of that worker’
•Y= ‘final grade of a student for this course’ and
X= ‘number of lectures/tutorials visited’
•Y= ‘weekly return of share Microsoft’ and
X = ‘weekly return of the Dow Jones stock index’
•.......
Introduction:
,Case: Relationship of the ebook sales ($) and the ebook pricing ($) published and sold by Amazon;
Period: January 2016; ebooks sold above 1000 pieces per day
Amazon is a (e)bookseller, but also an ebook publisher
Is the number of sold ebooks independent of their price?
Relation: Y = the number of sold ebooks, X = ebook price
Do the dollar sales of ebooks depend on their price?
Relation: Y = the dollar sales of ebook, X = ebook price
Which of the two quantiles is more price-sensitive?
Dataset: AmazonSales.sav (to be continued)
5.1 Scatter plot, Covariance and Correlation
Quantitative variables X and Y
, Questions:
-Are the y-data related to the corresponding x-data?
-Is it a linear relationship, that is, do the pairs of observations concentrate around a straight line?
-What is the degree (strength) of that linear relationship?
Objectives:
-Construct a plot visually relating the y-data and x-data.
-Find measures of association that measure the strength of the linear relationship.
Scatter plot: plot that depicts the pairs (xi, yi)
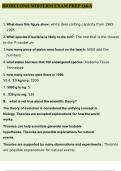
In the first graph, the points are close to the line. This means that the line approximates the
increasing relationship very well. In the second graph, the point are further removed from the line.
This means that the doesn’t approximate the decreasing relationship very well. In the third graph,
the mountain-shaped line implies that the growth is stagnating. A linear relationship (black line)
might not be the right form of dependence. Regarding the data, you have to determine which
relationship fits best. In the fourth graph there is a little positive relationship: the more GNI per
capita, the more happiness (it’s very hard to say what for relationship it is looking to the data)
General objectives:
-Single variable X: how can we measure/quantify the location and variation? Does it generalize to
multiple variables Y and X?
what we want to study: how strongly are X and Y related to each other? How much moves Y if X
changes? For that, we first have to find…. (see next line!)
-First, measures of association of Y and X are studied; covariance and correlation
-Later, study the variation of a variable Y
-Explain this variation by the dependence of Yon some other variable X.
[EbookCase: dependence of sales Yon price X]
-Consider regression of Y on X with
Y being the dependent variable and
X being the independent variable.
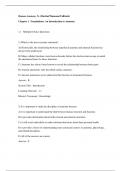
, Covariance:
interpretation: the higher the sales (x-axis), the higher the profits (y-axis). Area 1 is above both
averages, area 3 is under both averages. A positive relationship implies high sales in 1, low sales in 3.
If I compute in area 1 or 3, both quadrants have a positive (area 1) or a negative (area 3) sign. The
product of these both positive or negative sign give > 0. In area 2 and 4, one quadrant is either
positive or negative so the product is < 0.
Definitions of covariance: (can be faster and more handy then scatter plots!)
Sample dataset:
sample covariance
Population dataset:
population covariance
Remarks:
-notice the different notations (sample: Latin letters, population: Greek letters)
-sXY is often used as an estimate of the unknown XY
-division by n–1 leads generally to better estimates
see 1: both quadrants are
positive, so this
observation is in 1. See 3:
both observations are
negative, so the
observation is in 3. Etc..