Summary Research and Statistics 7U9X0
Bregje Kohlen
2021 – 2022
Summary of all the lectures of the course Research and Statistics at the TU/e.
Content
Summary Research and Statistics............................................................................................................ 1
Introduction............................................................................................................................................. 3
Lecture 1 Research methods ................................................................................................................... 3
Lecture 2 Statistical testing ..................................................................................................................... 5
Standard normal distribution .............................................................................................................. 5
Student t-distribution .......................................................................................................................... 6
Calculating a confidence interval within SPSS ................................................................................. 7
Rules for testing................................................................................................................................... 8
Interpreting SPSS results ..................................................................................................................... 8
Lecture 3 Bivariate analysis ..................................................................................................................... 8
Chi-square test .................................................................................................................................... 9
Two samples t-test ............................................................................................................................ 10
Independent samples t-test .......................................................................................................... 10
Paired samples t-test ..................................................................................................................... 11
Anova................................................................................................................................................. 11
Components of variance ............................................................................................................... 12
Post-hoc tests ................................................................................................................................ 13
Summary........................................................................................................................................ 14
Lecture 4 Correlation and regression .................................................................................................... 14
Correlation coefficient....................................................................................................................... 14
Regression analysis ............................................................................................................................ 15
Explained variance......................................................................................................................... 17
Lecture 5 multiple regression ................................................................................................................ 18
Partial standardized regression coefficient ................................................................................... 18
Unstandardized coefficient ........................................................................................................... 19
Multiple regression analysis .......................................................................................................... 19
Regression constant ...................................................................................................................... 19
Model selection ............................................................................................................................. 19
Selection methods in SPSS ............................................................................................................ 19
, Testing the regression coefficient ................................................................................................. 20
Requirements on sizes of samples ................................................................................................ 20
Multicollinearity ............................................................................................................................ 20
Dummy regression analysis ........................................................................................................... 21
Summary multiple regression ....................................................................................................... 21
Lecture 6 Non-parametric methods ...................................................................................................... 22
Non parametric methods .................................................................................................................. 22
Transforming ratio/interval scores to rank scores ........................................................................ 22
Mann-Whitney U test .................................................................................................................... 22
Kruskal-Wallis H test slide 12 ........................................................................................................ 23
Wilcoxon T-test.............................................................................................................................. 23
Spearman correlation .................................................................................................................... 24
(Dis)Advantages of non-parametric methods ............................................................................... 24
Representativeness of a sample........................................................................................................ 24
Lecture 7 Research methods (part 3) .................................................................................................... 25
Measurement instrument ................................................................................................................. 25
Operationalization ......................................................................................................................... 25
Reliability and validity ................................................................................................................... 25
Formulating survey questions ....................................................................................................... 26
Designing the questionnaire ......................................................................................................... 26
Data collection............................................................................................................................... 27
Sample size .................................................................................................................................... 28
Data preparation ........................................................................................................................... 28
Concluding remarks ....................................................................................................................... 28
Overview schemes................................................................................................................................. 29
1. Level of measurement ............................................................................................................... 29
2. Chi-squared test ........................................................................................................................ 29
3. Types of analysis for t-tests ....................................................................................................... 30
4. One sample t-test summary ...................................................................................................... 30
5. Two sample t-test summary ...................................................................................................... 30
6. When is which analysis allowed ................................................................................................ 31
7. ANOVA summary ....................................................................................................................... 32
,Lectures
Introduction
Empirical cycle always starts with observation.
The course is focused on social research.
Which is about data of individuals on their
behaviour, preferences or perceptions.
Quantitative research large sample /
surveys or experiments/ statistical analysis
(focus of this course)
Qualitative research small sample /
interviews, observations or case studies/ more on understanding interpretation
Statistical analysis is needed because machine learning cannot draw the same conclusions out of the
big data.
Lecture 1 Research methods
Problem formulation = research objective + research question
Research objective is a statement which includes:
• Why research is needed
• What purpose will the knowledge be used
• To determine which setup of the research is needed to make sure results are interpreted
correctly
• Do not include the final goal
Research question of which the answer will lead to obtaining the objective. It consists out of 2 or
more sub question, indicating the more specific steps to answer the research question.
Different types of research questions
• Frequency questions how many, how often descriptive analysis
• Difference questions is there a difference between, includes two variables
two groups, two instruments
• Relation questions is there a relation between has a + or – correlation
Conceptual model is the bridge between the research questions and the actual plan of analysis.
Indicating; 1) all variables that must be considered. 2) how the variables relate to each other 3)shows
the function of the complete analysis helps with formulating hypotheses and research questions.
Between the variables in the conceptual model arrows are placed, all arrows end at the (or
two) variable of ultimate interest. If it is unclear which causes/ influences which a line is used
It is important that all variables have the same unit of analysis(for all social science this holds)
Relationships must have causal relationships (not both influenced by another variable) and
one should happen earlier in time than the other.
Causality X causes Y. with x being independent and y dependent. Only predictions can be made
when we know what the cause and what the effect is. Conditions for it:
• Statistical correlation can be measured
, • Cause before the effect time dependence can be a problem
• No spurious relationship measure all potential alternative causes and test if the
correlation still exists
• Theory: causal mechanism how does the cause generate the effect
Spurious relationships there is a correlation but there is not clear what the cause is and what the
effect is, both are affected by another variable. Spurious relationships lead to wrong conclusions.
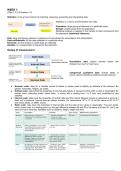
So quantitative research is done in experiments or surveys of which the main characteristics are:
Experiment
• One group with treatment and one group without which is the control group
• Much control by researcher on independent variable, alternative explanations are ruled out
• Statistical analysis is simple
• Used for: measuring effects of treatments or evaluative research
• Net effect of treatment = (Y2 – Y1) – (Y4-Y3)
• Before and after measurement
• Randomization
Survey
• Large group of respondents fill in a questionnaire
• Less control by researcher on ruling out alternative explanations needs to be tested on
spurious relationships
• Advanced statistics
• Used for: explorative and descriptive research
• One moment measurement
• Large numbers
• Good to use when
o There are predictors that cannot be controlled
o Non-observable variables (motives, reasons, past behaviour)
o Time control is not important
Validity do we measure what we intend to measure
Internal validity are the casual interpretations in research valid/ are all alternative explanations
ruled out? (low for the survey, high for the experiment)
External validity are results generalizable outside of the test group so to different places, times,
groups and circumstances? (low for the experiment, high for the survey)
Level of measurement shows how numbers should be interpreted and which analysis technique is
allowed
• Nominal level: numbers just indicate the categories, no ordering. (f.e. color, gender,
transport.)Dichotomous values are for nominal levels with only 2 categories f.e. gender.
• Ordinal level: there is an order, the difference between the numbers/ categories is not
equal. (f.e. level of education.)
• Interval level: there is an order, equal intervals, there is no absolute zero value. (f.e.
intelligence IQ you cannot say a value is twice is big.) (so an relative scale)
Bregje Kohlen
2021 – 2022
Summary of all the lectures of the course Research and Statistics at the TU/e.
Content
Summary Research and Statistics............................................................................................................ 1
Introduction............................................................................................................................................. 3
Lecture 1 Research methods ................................................................................................................... 3
Lecture 2 Statistical testing ..................................................................................................................... 5
Standard normal distribution .............................................................................................................. 5
Student t-distribution .......................................................................................................................... 6
Calculating a confidence interval within SPSS ................................................................................. 7
Rules for testing................................................................................................................................... 8
Interpreting SPSS results ..................................................................................................................... 8
Lecture 3 Bivariate analysis ..................................................................................................................... 8
Chi-square test .................................................................................................................................... 9
Two samples t-test ............................................................................................................................ 10
Independent samples t-test .......................................................................................................... 10
Paired samples t-test ..................................................................................................................... 11
Anova................................................................................................................................................. 11
Components of variance ............................................................................................................... 12
Post-hoc tests ................................................................................................................................ 13
Summary........................................................................................................................................ 14
Lecture 4 Correlation and regression .................................................................................................... 14
Correlation coefficient....................................................................................................................... 14
Regression analysis ............................................................................................................................ 15
Explained variance......................................................................................................................... 17
Lecture 5 multiple regression ................................................................................................................ 18
Partial standardized regression coefficient ................................................................................... 18
Unstandardized coefficient ........................................................................................................... 19
Multiple regression analysis .......................................................................................................... 19
Regression constant ...................................................................................................................... 19
Model selection ............................................................................................................................. 19
Selection methods in SPSS ............................................................................................................ 19
, Testing the regression coefficient ................................................................................................. 20
Requirements on sizes of samples ................................................................................................ 20
Multicollinearity ............................................................................................................................ 20
Dummy regression analysis ........................................................................................................... 21
Summary multiple regression ....................................................................................................... 21
Lecture 6 Non-parametric methods ...................................................................................................... 22
Non parametric methods .................................................................................................................. 22
Transforming ratio/interval scores to rank scores ........................................................................ 22
Mann-Whitney U test .................................................................................................................... 22
Kruskal-Wallis H test slide 12 ........................................................................................................ 23
Wilcoxon T-test.............................................................................................................................. 23
Spearman correlation .................................................................................................................... 24
(Dis)Advantages of non-parametric methods ............................................................................... 24
Representativeness of a sample........................................................................................................ 24
Lecture 7 Research methods (part 3) .................................................................................................... 25
Measurement instrument ................................................................................................................. 25
Operationalization ......................................................................................................................... 25
Reliability and validity ................................................................................................................... 25
Formulating survey questions ....................................................................................................... 26
Designing the questionnaire ......................................................................................................... 26
Data collection............................................................................................................................... 27
Sample size .................................................................................................................................... 28
Data preparation ........................................................................................................................... 28
Concluding remarks ....................................................................................................................... 28
Overview schemes................................................................................................................................. 29
1. Level of measurement ............................................................................................................... 29
2. Chi-squared test ........................................................................................................................ 29
3. Types of analysis for t-tests ....................................................................................................... 30
4. One sample t-test summary ...................................................................................................... 30
5. Two sample t-test summary ...................................................................................................... 30
6. When is which analysis allowed ................................................................................................ 31
7. ANOVA summary ....................................................................................................................... 32
,Lectures
Introduction
Empirical cycle always starts with observation.
The course is focused on social research.
Which is about data of individuals on their
behaviour, preferences or perceptions.
Quantitative research large sample /
surveys or experiments/ statistical analysis
(focus of this course)
Qualitative research small sample /
interviews, observations or case studies/ more on understanding interpretation
Statistical analysis is needed because machine learning cannot draw the same conclusions out of the
big data.
Lecture 1 Research methods
Problem formulation = research objective + research question
Research objective is a statement which includes:
• Why research is needed
• What purpose will the knowledge be used
• To determine which setup of the research is needed to make sure results are interpreted
correctly
• Do not include the final goal
Research question of which the answer will lead to obtaining the objective. It consists out of 2 or
more sub question, indicating the more specific steps to answer the research question.
Different types of research questions
• Frequency questions how many, how often descriptive analysis
• Difference questions is there a difference between, includes two variables
two groups, two instruments
• Relation questions is there a relation between has a + or – correlation
Conceptual model is the bridge between the research questions and the actual plan of analysis.
Indicating; 1) all variables that must be considered. 2) how the variables relate to each other 3)shows
the function of the complete analysis helps with formulating hypotheses and research questions.
Between the variables in the conceptual model arrows are placed, all arrows end at the (or
two) variable of ultimate interest. If it is unclear which causes/ influences which a line is used
It is important that all variables have the same unit of analysis(for all social science this holds)
Relationships must have causal relationships (not both influenced by another variable) and
one should happen earlier in time than the other.
Causality X causes Y. with x being independent and y dependent. Only predictions can be made
when we know what the cause and what the effect is. Conditions for it:
• Statistical correlation can be measured
, • Cause before the effect time dependence can be a problem
• No spurious relationship measure all potential alternative causes and test if the
correlation still exists
• Theory: causal mechanism how does the cause generate the effect
Spurious relationships there is a correlation but there is not clear what the cause is and what the
effect is, both are affected by another variable. Spurious relationships lead to wrong conclusions.
So quantitative research is done in experiments or surveys of which the main characteristics are:
Experiment
• One group with treatment and one group without which is the control group
• Much control by researcher on independent variable, alternative explanations are ruled out
• Statistical analysis is simple
• Used for: measuring effects of treatments or evaluative research
• Net effect of treatment = (Y2 – Y1) – (Y4-Y3)
• Before and after measurement
• Randomization
Survey
• Large group of respondents fill in a questionnaire
• Less control by researcher on ruling out alternative explanations needs to be tested on
spurious relationships
• Advanced statistics
• Used for: explorative and descriptive research
• One moment measurement
• Large numbers
• Good to use when
o There are predictors that cannot be controlled
o Non-observable variables (motives, reasons, past behaviour)
o Time control is not important
Validity do we measure what we intend to measure
Internal validity are the casual interpretations in research valid/ are all alternative explanations
ruled out? (low for the survey, high for the experiment)
External validity are results generalizable outside of the test group so to different places, times,
groups and circumstances? (low for the experiment, high for the survey)
Level of measurement shows how numbers should be interpreted and which analysis technique is
allowed
• Nominal level: numbers just indicate the categories, no ordering. (f.e. color, gender,
transport.)Dichotomous values are for nominal levels with only 2 categories f.e. gender.
• Ordinal level: there is an order, the difference between the numbers/ categories is not
equal. (f.e. level of education.)
• Interval level: there is an order, equal intervals, there is no absolute zero value. (f.e.
intelligence IQ you cannot say a value is twice is big.) (so an relative scale)