LES 2
Multiple (=meervoudige) regressie (H3)
Y i= β^ 0 + β^ 1 X 1 i+ β^ 1 X 1 i+ …+ ^β k X ki + u^ i
1. Deriving OLS estimators argmin
β
SSR Minimaliseren door bèta’s te
n 2 veranderen
argmin (Σ i=1 u^ i )
β
Y ˆ1
ˆ 2
ˆ 0
Coef. Std. Err. t P>|t| [95% Conf. Interval]
X1 .3318305 .1721011 1.93 0.067 -.0250853 .6887462
X2 .1257858 .037688 3.34 0.003 .0476257 .2039458
_cons 36.79008 17.29449 2.13 0.045 .9235081 72.65665
Voorbeeld: consumptie of 25 Households
Data on 25 households
Impact of income (X1) and wealth in stocks (X2) on private consumption (Y) (in
€1000)
Yi = 0 + 1X1i + 2X2i + ui
Coefficients measure the impact of a 1 unit increase of an X-variable on
the mean value of Y, holding the values of the other X-variables
constant
It measures the net or direct effect of an X on Y
Short results OLS-estimation
1
, 2
2 σu
2. Precision of OLS estimators σ β = 2 2
σ X ( 1−r X )
Y Coef. Std. Err. t P>|t| [95% Conf. Interval]
X1 en X2 moeten X1 .3318305 .1721011 1.93 0.067 -.0250853 .6887462
onafhankelijk zijn
X2 .1257858 .037688 3.34 0.003 .0476257 .2039458
van elkaar =
ceteris paribus _cons 36.79008 17.29449 2.13 0.045 .9235081 72.65665
Hoe > spreiding rond X: hoe zekerder we zijn van de parameters
Goodness-of-fit?
Do we have a good model?
2 SSM SSR
R-squared R = =1−
SST SST
Do we have a better model? (comparing)
3 important conditions on using R-squared
1. Sample (size) must be the same
2. Dependent variable must be the same
3. Number of estimated parameters must be the same
. reg Y X1 X2
Source SS df MS Number of obs = 25
F(2, 22) = 42.71
Model 126186.655 2 63093.3276 Prob > F = 0.0000
Residual 32501.9575 22 1477.36171 R-squared = 0.7952
Adj R-squared = 0.7766
Total 158688.613 24 6612.02553 Root MSE = 38.436
SSR
N−k ( N−1 )
2 2
Adjusted R-squared Adj . R =R =1− =1−( 1−R 2)
SST N −k
N −1
Corrects (penalizes) for the number of estimated parameters: zorgt ervoor
dat je niet oneindig parameters opneemt: hoe > k hoe < adjusted r²
Conditions
1. Sample (size) must be the same
2. Dependent variable must be the same
How to work with STATA
Import first row as variable names
Data editor
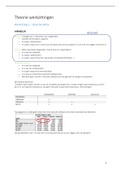
Sum
. sum
Variable Obs Mean Std. Dev. Min Max
household 25 13 7.359801 1 25
Y 25 163.2936 81.31436 45.73 373
X1 25 163.204 83.23113 36.4 312
X2 25 575.164 380.0727 26 1536.6
2
Multiple (=meervoudige) regressie (H3)
Y i= β^ 0 + β^ 1 X 1 i+ β^ 1 X 1 i+ …+ ^β k X ki + u^ i
1. Deriving OLS estimators argmin
β
SSR Minimaliseren door bèta’s te
n 2 veranderen
argmin (Σ i=1 u^ i )
β
Y ˆ1
ˆ 2
ˆ 0
Coef. Std. Err. t P>|t| [95% Conf. Interval]
X1 .3318305 .1721011 1.93 0.067 -.0250853 .6887462
X2 .1257858 .037688 3.34 0.003 .0476257 .2039458
_cons 36.79008 17.29449 2.13 0.045 .9235081 72.65665
Voorbeeld: consumptie of 25 Households
Data on 25 households
Impact of income (X1) and wealth in stocks (X2) on private consumption (Y) (in
€1000)
Yi = 0 + 1X1i + 2X2i + ui
Coefficients measure the impact of a 1 unit increase of an X-variable on
the mean value of Y, holding the values of the other X-variables
constant
It measures the net or direct effect of an X on Y
Short results OLS-estimation
1
, 2
2 σu
2. Precision of OLS estimators σ β = 2 2
σ X ( 1−r X )
Y Coef. Std. Err. t P>|t| [95% Conf. Interval]
X1 en X2 moeten X1 .3318305 .1721011 1.93 0.067 -.0250853 .6887462
onafhankelijk zijn
X2 .1257858 .037688 3.34 0.003 .0476257 .2039458
van elkaar =
ceteris paribus _cons 36.79008 17.29449 2.13 0.045 .9235081 72.65665
Hoe > spreiding rond X: hoe zekerder we zijn van de parameters
Goodness-of-fit?
Do we have a good model?
2 SSM SSR
R-squared R = =1−
SST SST
Do we have a better model? (comparing)
3 important conditions on using R-squared
1. Sample (size) must be the same
2. Dependent variable must be the same
3. Number of estimated parameters must be the same
. reg Y X1 X2
Source SS df MS Number of obs = 25
F(2, 22) = 42.71
Model 126186.655 2 63093.3276 Prob > F = 0.0000
Residual 32501.9575 22 1477.36171 R-squared = 0.7952
Adj R-squared = 0.7766
Total 158688.613 24 6612.02553 Root MSE = 38.436
SSR
N−k ( N−1 )
2 2
Adjusted R-squared Adj . R =R =1− =1−( 1−R 2)
SST N −k
N −1
Corrects (penalizes) for the number of estimated parameters: zorgt ervoor
dat je niet oneindig parameters opneemt: hoe > k hoe < adjusted r²
Conditions
1. Sample (size) must be the same
2. Dependent variable must be the same
How to work with STATA
Import first row as variable names
Data editor
Sum
. sum
Variable Obs Mean Std. Dev. Min Max
household 25 13 7.359801 1 25
Y 25 163.2936 81.31436 45.73 373
X1 25 163.204 83.23113 36.4 312
X2 25 575.164 380.0727 26 1536.6
2