MATH533_-_Week_2_Course_Project_Part_A VERY CORRECT
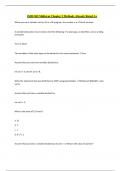
Week 2: Course Project Part A 5 6000 12 10 8 6 4 2 0 Credit Balance($) Fre q u e ncy 2 5 8 11 9 5 6 3 1 Histogramof Credit Balance($) The mean credit balance of the customers is given as $4153. The standard deviation is given approximately as 932. The credit balance of the customers is more or less normally distributed with the peak of the bell shaped distribution lying in the range $3292 - $4931. Thus, maximum number of customers has a credit balance within this range. This study source was downloaded by from CourseH on :14:35 GMT -06:00 This study resource was shared via CourseH Week 2: Course Project Part A 6 The relationship between the location and Income is illustrated in the following Bar Chart: Urban Rural Suburban 1200 1000 800 600 400 200 0 Location Inco me ($1,0 0 0) 709 488 1104 Chart of Income ($1,000) From the Bar Chart, we can conclude that urban customers have the higher income, and then followed by suburban and rural. The relationship between the location and size is illustrated in the following Stacked Bar Chart: Location Rural Suburban

Geschreven voor
- Instelling
- University Of San Francisco
- Vak
- NURSING 101
Documentinformatie
- Geüpload op
- 22 november 2021
- Aantal pagina's
- 8
- Geschreven in
- 2021/2022
- Type
- Tentamen (uitwerkingen)
- Bevat
- Vragen en antwoorden
Onderwerpen
-
math53 courseproject
-
math533 project