Tentamen (uitwerkingen)
maths 225N Week 2 Graphs Homework Help Questions and Answers
Beoordeling
Verkocht
-
Pagina's
20
Cijfer
A+
Geüpload op
14-09-2021
Geschreven in
2021/2022
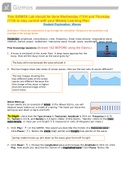
Week 2 Assignment: Frequency Tables Q & A 1. A data set is summarized in the frequency table below. Using the table, determine the number of values less than or equal to 5. Give your answer as a single number. For example if you found the number of values was 19, you would enter 19. 5 11 4 Provide your answer below: 16 2. Given the frequency table, how many times does the data value 3 show up in the data set? 3. A group of students were surveyed about the number of siblings they have. The frequencies and relative frequencies of their responses are shown in the below. Complete the cumulative relative frequency table.
Meer zien
Lees minder
Instelling
Vak
Oeps! We kunnen je document nu niet laden. Probeer het nog eens of neem contact op met support.
Geschreven voor
- Instelling
- Chamberlain College Of Nursing
- Vak
- MAT 225 N Statistical Reasoning For The Health Sciences
Alle documenten voor dit vak (17)
Documentinformatie
- Geüpload op
- 14 september 2021
- Aantal pagina's
- 20
- Geschreven in
- 2021/2022
- Type
- Tentamen (uitwerkingen)
- Bevat
- Vragen en antwoorden
Onderwerpen
-
week 2 assignment frequency tables q amp a 1 a data set is summarized in the frequency table below using the table
-
determine the number of values less than or equal to 5 give your answer as a s
€9,28
Krijg toegang tot het volledige document:
100% tevredenheidsgarantie
Direct beschikbaar na je betaling
Lees online óf als PDF
Geen vaste maandelijkse kosten