Managerial Statistics
(9th edition – Gerald Keller)
When To Use Which
Test (Statistics)
OVERVIEW OF ALL STATISTICAL TEST AND THEIR PURPOSE
(INCLUDING PAGE NUMBERS)
University of Groningen
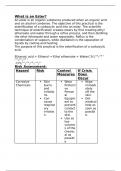
,Interval Temperature, the intervals between each value are equally split
Nominal Categorical, passed" vs. "failed" by "male" vs. "female"
Ordinal Rating scale from 1 to 5
Ration Time, data is interval data with a natural zero point
Describe population
Ordinal data is not statistically covered
NOTE! Standard deviation is the square root of the variance
Interval data
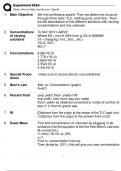
Z-test to calculate specific area (known deviation) (267): Calculate the probability that a
specific value falls into a specific interval (i.e. calculate when to repair/reorder something).
Calculate reorder point (p.278).
Calculate left area: P(X<Y) P(Z<Y)
Calculate right area: P(X>Y) P(Z>Y) = 1 – P(Z<Y)
Calculate area between two points: P(Z<Y) – P(Z<Y) (right boundary minus left
boundary)
When sample size is known, use formula on P.312
Z-test to calculate population mean (known deviation) (confidence interval, 334):
Calculate population mean when the population standard deviation is known and the
population is normally distributed.
Confidence levels and their Z-values
A = 0.1 A/2 = 0.05 Z0.05 = 1.645
A = 0.05 A/2=0.025 Z0.025= 1.96
A= 0.02 A/2= 0.01 Z0.01= 2.33
A= 0.01 A/2= 0.005 Z0.005 = 2.575
Calculate sample size (P.348)
T-test to calculate specific area (unknown deviation) (394): Test a hypothesis about the
population mean (area smaller or larger than the mean) by using a sample, when the
when the population standard deviation is unknown and the population is normally
distributed.
Degrees of freedom: V= n – 1
Calculate left area (<): rejection region T < a/2, v-1 < – (critical value)
Calculate right area (>): rejection region T > a/2, v-1 + (critical value)
Calculate right area (≠): rejection region T ≠ a, v-1 +– (critical value)
, T test to calculate population mean (unknown deviation) (confidence interval, 394):
Calculate population mean by using a sample when the population standard deviation is
unknown and the population is normally distributed. (One sample T-test, no relationship
between the observations)
Degrees of freedom: V= n – 1
Use formulas on page 398
X²-Test (Chi-Squared) and estimator of population variance (408): Used to determine the
variance of a population based on a sample. Estimate variance interval (P. 408)
Degrees of freedom: V= n – 1
Calculate left area (<): rejection region, X² < X² 1-a, n-1
Calculate right area (>): rejection region, X² > X²a, n-1
Calculate left and right area (≠) rejection region, X² ≠ X²a/2, n-1
Nominal data
Two categories
Z-test and estimator of P (population proportion) (confidence interval, 417,421): Used to
calculate how a sample is distributed (proportion of successes). (When P-hat, X/n, is
unknown, use 0.5).
Z-test and estimator of P (population proportion) (test hypothesis, 418): Used to test
statements about the amount of successes within a population.
Calculate left area: P(X<Y) P(Z<Y)
Calculate right area: P(X>Y) (P(Z>Y) = 1 – P(Z<Y)
Calculate area between two points: P(Z<Y) – P(Z<Y) (right boundary minus left
boundary)
Rejection region: Za
P. 320 for P-hat (without Z-score, same formula though)
P. 422: select sample size needed to estimate the proportion
≥ Two categories (groups) – independent observations - variable must be mutually
exclusive (only A or B, not both can occur) - at least 5 expected frequencies in each group
of the variable
X²- goodness-of-fit test (578, 579): calculate how "close" the observed values are to those
which are expected. Does it fit the expectance? A small test statistic supports the null
hypothesis.
Rejection region: X² > X² a, k-1 (where k is the number of variables i.e. cells).
Fi: observed frequency
Ei: Expected frequency
(9th edition – Gerald Keller)
When To Use Which
Test (Statistics)
OVERVIEW OF ALL STATISTICAL TEST AND THEIR PURPOSE
(INCLUDING PAGE NUMBERS)
University of Groningen
,Interval Temperature, the intervals between each value are equally split
Nominal Categorical, passed" vs. "failed" by "male" vs. "female"
Ordinal Rating scale from 1 to 5
Ration Time, data is interval data with a natural zero point
Describe population
Ordinal data is not statistically covered
NOTE! Standard deviation is the square root of the variance
Interval data
Z-test to calculate specific area (known deviation) (267): Calculate the probability that a
specific value falls into a specific interval (i.e. calculate when to repair/reorder something).
Calculate reorder point (p.278).
Calculate left area: P(X<Y) P(Z<Y)
Calculate right area: P(X>Y) P(Z>Y) = 1 – P(Z<Y)
Calculate area between two points: P(Z<Y) – P(Z<Y) (right boundary minus left
boundary)
When sample size is known, use formula on P.312
Z-test to calculate population mean (known deviation) (confidence interval, 334):
Calculate population mean when the population standard deviation is known and the
population is normally distributed.
Confidence levels and their Z-values
A = 0.1 A/2 = 0.05 Z0.05 = 1.645
A = 0.05 A/2=0.025 Z0.025= 1.96
A= 0.02 A/2= 0.01 Z0.01= 2.33
A= 0.01 A/2= 0.005 Z0.005 = 2.575
Calculate sample size (P.348)
T-test to calculate specific area (unknown deviation) (394): Test a hypothesis about the
population mean (area smaller or larger than the mean) by using a sample, when the
when the population standard deviation is unknown and the population is normally
distributed.
Degrees of freedom: V= n – 1
Calculate left area (<): rejection region T < a/2, v-1 < – (critical value)
Calculate right area (>): rejection region T > a/2, v-1 + (critical value)
Calculate right area (≠): rejection region T ≠ a, v-1 +– (critical value)
, T test to calculate population mean (unknown deviation) (confidence interval, 394):
Calculate population mean by using a sample when the population standard deviation is
unknown and the population is normally distributed. (One sample T-test, no relationship
between the observations)
Degrees of freedom: V= n – 1
Use formulas on page 398
X²-Test (Chi-Squared) and estimator of population variance (408): Used to determine the
variance of a population based on a sample. Estimate variance interval (P. 408)
Degrees of freedom: V= n – 1
Calculate left area (<): rejection region, X² < X² 1-a, n-1
Calculate right area (>): rejection region, X² > X²a, n-1
Calculate left and right area (≠) rejection region, X² ≠ X²a/2, n-1
Nominal data
Two categories
Z-test and estimator of P (population proportion) (confidence interval, 417,421): Used to
calculate how a sample is distributed (proportion of successes). (When P-hat, X/n, is
unknown, use 0.5).
Z-test and estimator of P (population proportion) (test hypothesis, 418): Used to test
statements about the amount of successes within a population.
Calculate left area: P(X<Y) P(Z<Y)
Calculate right area: P(X>Y) (P(Z>Y) = 1 – P(Z<Y)
Calculate area between two points: P(Z<Y) – P(Z<Y) (right boundary minus left
boundary)
Rejection region: Za
P. 320 for P-hat (without Z-score, same formula though)
P. 422: select sample size needed to estimate the proportion
≥ Two categories (groups) – independent observations - variable must be mutually
exclusive (only A or B, not both can occur) - at least 5 expected frequencies in each group
of the variable
X²- goodness-of-fit test (578, 579): calculate how "close" the observed values are to those
which are expected. Does it fit the expectance? A small test statistic supports the null
hypothesis.
Rejection region: X² > X² a, k-1 (where k is the number of variables i.e. cells).
Fi: observed frequency
Ei: Expected frequency