Human Capital
Human Capital in the form of Health
• Human capital: consists of qualities of people that are productive and qualities that are produced via
investment. Differences in HC may explain income differences
• Health is intrinsically valuable and raises productivity: work harder (intensive margin), new people enter LF
(extensive) & learn more
• Fogel study: from 1780-1980, improved nutrition raised output by 0.33% per year which was less than 1/3
of the overall growth in income over the period
• 2 way interaction of h & y: better nutrition raises and is caused by higher income: causality issue
- Wealthier people can also afford better inputs into health e.g. vaccines
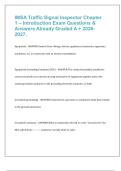
• Diagram: as health rises, workers can produce more output so y(h) curve slopes up.
- But h(y): impact of income per capita on health is diminishing
• If technology improves, y(h) curve shifts right. If no change in workers’ health, the increase in output
would match the increase in productivity. Move from A to B
- But then the rise in output/income improves workers’ health so this causes a multiplier effect and
output rises again. Shown by move from B to C
• Health view: differences in y due to h so higher h(y) for rich country but same y(h)
- poor health causes low income per capita
• Income view: difference in y due to higher h for rich country y(h) is further right
• Acemoglu: Looks at effect of h on y. 1) Health (life expectancy) raises HC and thus income.
- Use IV based on international epidemiological transition (vaccines) for life expectancy
- Biggest impact on countries that were initially poor. Small effect of life expectancy on total GDP but population rise
• Found higher health reduced income per capita as it led to large rise in population as mortality fell and so it counteracted 1)
Human Capital in the form of Education
• Education is an investment in building human capital but hard to measure return to education as omitted variables
- Has a financial and opportunity cost (wages foregone). Estimate: 1/2 of cost of education is opportunity cost
- Issue is that wage consists of one part due to raw labour (person with 0 HC) and other part due to HC
• Return to education: increase in wages from 1 more year of schooling. E.g. if rate of return= 13%, that person will earn 1.13 times
more than a person with no schooling. If person has 4 years, they earn 1.134 times more than no schooling
• Earlier years of schooling have higher returns as they teach the most important skills
• College premium rose even though supply of college educated workers increased due to rising demand for these people.
- Due to free trade & because tech change was skill based. Tech could replace low skilled but was a complement to high skilled (IT)
• 1/3 of GDP goes to owners of physical capital so 2/3 goes to labour
- We can find how much of this payment is for human capital & how much is for raw labour (if HC=0)
• E.g. a worker has 5 years of education and return to 5th year is 10% so the worker’s wage is 1.134 x
1.1=1.82 times as a person with no education. If the no education person earned $1 then $0.82 is the part
of the wage from human capital and $1 is the raw labour part
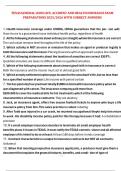
• Graph: solid line is for different levels of education, relative to none. Bottom 5% of LF have no HC
• Distance between solid and dashed is the part of the wage due to human capital.
- Total area above dashed line= total wages paid to human capital
- To find human capital’s share of GDP, multiply HC’s share of wages (≈65%) by 2/3
Education and the Variation in Income Across Countries
• Assume countries differ in the amount of labour input per worker (h)
• L number of workers to total labour input is Lh so Y = AKα(hL)1-α = h1-αAKαL1-α
• We get the steady state output per worker- it’s proportional to h so as h rises, yss rises
• To determine the effect of education on h, we can consider the wage.
- So a person with 1 year of schooling earns 1.13 times more
- We can say they supply 1.13 times more units of labour than with no education (denote as h0)
• Ratio between 2 countries: y1/y2=h1/h2
• If each unit of labour is paid a fixed amount, the wage earned is proportional to labour input h
• variation in education explains some of the variation in income per worker among countries
• Issue: quality of schooling varies between countries, so results understate the true difference in HC
• Issue 2: externalities mean that education raises individual’s output and the output of those around them, esp in poorer nations.
• Positive externality means underinvestment in education so government intervenes. Understates impact of HC in income differences
• HC will play less of a role in future as health is unlikely to keep improving and education can’t rise forever as we have to start working
, TFP
Accounting
• Productivity/TFP A is the effectiveness with which factors of production are converted into output.
- Countries differ in their accumulation of inputs and their productivity but we can only measure
• Y=AKα(hL)1-α & in per worker terms y = Akαh1-α, we write factors of production =kαh1-α
- So output= productivity x factors of production. Called development accounting
• Take logs for Growth accounting: y# = # ̂ + #αk# ̂ + (1 - #α)#ĥ for growth rate in per worker, weighted by elasticity
̂ A
• Can compare countries: ratio of output= Ratio of productivity x ratio of factors of production.
- The larger the ratio of factors, the smaller the productivity gap. But can’t measure A (it’s the residual)
• Among the richest 1/5 of countries, productivity and factor accumulation are of almost equal importance in
explaining the gap in income relative to US
- For poor countries factor accumulation is more important in explaining why country is poor
• Wider productivity growth range between rich and poor countries
• Productivity growth is far more important than factor growth in explaining variation in output growth rates
Hsieh and Klenow (2010): Development Accounting
• Fundamentals: geography, climate affects institutions and culture which affect policies and law
• Proximate causes of growth: from the Solow model A,K,L
- Found that K accounts for 20% of income differences, h is 10-30% and A is 50-70%
• Firm level TFP differences and misallocation of resources between firms affects relative TFP
between sectors which affects the physical capital and HC accumulation which then affects y
- Use Y=AKα(hL)1-α where L= labour supply not population i.e. workers times hours
• They find that the K/Y capital to output ratio is correlated with income level
• Why rich countries have a higher K/Y: theory suggests poor countries can’t save: risk of appropriation
- But results suggest not true: poor don’t have less investment when we consider in domestic prices
- PPP investment rate is I/Y but domestic price investment rate is PIxI/PY xY
• Maybe in poor countries, tradeable investment goods are more expensive: importing them (transport costs)
and trade barriers. But not supported: price of equipment is not higher so investment not more expensive
• Remaining reason is cheap consumption in poor countries so people don’t save and so can’t invest
- Since relative TFP in poor countries is lower in producing investment goods than consumption goods
- Less efficient for them to produce investment goods than consumption: lack the tech i.e. AC/AI>1
• Relative TFP matters: if higher for consumption goods, less investment and less physical capital accumulation
• HC investment higher in rich countries maybe as higher returns. But still high returns in poor countries.
• Not explained by Mincer Model (MC=MB). Higher TFP can reduce the cost of schooling relative to output
• Firm quality varies in economy affecting TFP: misallocation of labour and capital to inefficient/zombie firms
Technology
• In SS, k and y are constant but Y and K grow at n. Now we let A grow by a rate g
• Motion of capital: Kt+1=(1-𝛿)Kt+γYt . Divide by AtLt . Define k̃t= Kt/AtLt & ỹt= Yt/AtLt
• Kt+1/AtLt=(1-𝛿)Kt /AtLt+γYt/AtLt and manipulate [Kt+1/At+1Lt+1] [At+1Lt+1 /AtLt]=(1-𝛿)Kt /AtLt+γYt/AtLt
• So k̃t+1 (1+g)(1+n)=(1-𝛿)k̃t +γỹt but in SS k̃t+1 = k̃t = k̃ss so γỹss =(g+n+𝛿)k̃ss
• In the SS, k̃ss and ỹss are constant but kss=At k̃ss and yss=At ỹss grow at g (derived from k=K/L subbed in)
- Since tilda grows at 0 and A grows at g. So with tech progress, in the SS GDP per capita is unchanged
- Called exogenous growth model: rate of tech progress g is given
• Productivity= tech, efficiency and management. Tech allows us to escape diminishing returns to HC and K
• Gov supports R&D through tax breaks and patents (since tech is non-rival & partly non-excludable so need
incentive to invest)
• R&D determined by profit consideration (monopoly and supernormal profit but depends on size of market ,
patents, size of advantage and uncertainty over R&D) and creative destruction (new tech replaces old)
, TFP
Accounting
• Productivity/TFP A is the effectiveness with which factors of production are converted into output.
- Countries differ in their accumulation of inputs and their productivity but we can only measure
• Y=AKα(hL)1-α & in per worker terms y = Akαh1-α, we write factors of production =kαh1-α
- So output= productivity x factors of production. Called development accounting
# ̂ + #αk# ̂ + (1 - #α)#ĥ for growth rate in per worker, weighted by elasticity
̂ A
• Take logs for Growth accounting: y# =
• Can compare countries: ratio of output= Ratio of productivity x ratio of factors of production.
- The larger the ratio of factors, the smaller the productivity gap. But can’t measure A (it’s the residual)
• Among the richest 1/5 of countries, productivity and factor accumulation are of almost equal importance in
explaining the gap in income relative to US
- For poor countries factor accumulation is more important in explaining why country is poor
• Wider productivity growth range between rich and poor countries
• Productivity growth is far more important than factor growth in explaining variation in output growth rates
Hsieh and Klenow (2010): Development Accounting
• Proximate causes of growth: from the Solow model A,K,L
• Fundamentals: geography, climate affects institutions and culture which affect policies and law
• Found that K accounts for 20% of income differences, h is 10-30% and A is 50-70% of income difference
• Firm level TFP differences and misallocation of resources between firms affects relative TFP
between sectors which affects the physical capital and HC accumulation which then affects y
- Use Y=AKα(hL)1-α where L= labour supply not population i.e. workers times hours
• They find that the K/Y capital to output ratio is correlated with income level
• Why rich countries have a higher K/Y: theory may suggest as poor countries can’t save, risk of appropriation
• But results suggest not true: poor don’t have less investment when we consider in domestic prices
• Maybe in poor countries, tradeable investment goods are more expensive: importing them so transport costs
and trade barriers. But theory not supported: price of equipment is not higher so investment not more
expensive
• Remaining reason is cheap consumption in poor countries so people don’t save and so can’t invest
- Since relative TFP in poor countries is lower in producing investment goods than consumption goods
• Relative TFP matters: if higher for consumption goods, less investment and less physical capital accumulation
• HC investment higher in rich countries. But not explained by Mincer Model (MC=MB)
• Higher TFP can reduce the cost of schooling relative to output
Technology
Human Capital in the form of Health
• Human capital: consists of qualities of people that are productive and qualities that are produced via
investment. Differences in HC may explain income differences
• Health is intrinsically valuable and raises productivity: work harder (intensive margin), new people enter LF
(extensive) & learn more
• Fogel study: from 1780-1980, improved nutrition raised output by 0.33% per year which was less than 1/3
of the overall growth in income over the period
• 2 way interaction of h & y: better nutrition raises and is caused by higher income: causality issue
- Wealthier people can also afford better inputs into health e.g. vaccines
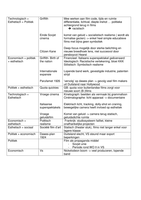
• Diagram: as health rises, workers can produce more output so y(h) curve slopes up.
- But h(y): impact of income per capita on health is diminishing
• If technology improves, y(h) curve shifts right. If no change in workers’ health, the increase in output
would match the increase in productivity. Move from A to B
- But then the rise in output/income improves workers’ health so this causes a multiplier effect and
output rises again. Shown by move from B to C
• Health view: differences in y due to h so higher h(y) for rich country but same y(h)
- poor health causes low income per capita
• Income view: difference in y due to higher h for rich country y(h) is further right
• Acemoglu: Looks at effect of h on y. 1) Health (life expectancy) raises HC and thus income.
- Use IV based on international epidemiological transition (vaccines) for life expectancy
- Biggest impact on countries that were initially poor. Small effect of life expectancy on total GDP but population rise
• Found higher health reduced income per capita as it led to large rise in population as mortality fell and so it counteracted 1)
Human Capital in the form of Education
• Education is an investment in building human capital but hard to measure return to education as omitted variables
- Has a financial and opportunity cost (wages foregone). Estimate: 1/2 of cost of education is opportunity cost
- Issue is that wage consists of one part due to raw labour (person with 0 HC) and other part due to HC
• Return to education: increase in wages from 1 more year of schooling. E.g. if rate of return= 13%, that person will earn 1.13 times
more than a person with no schooling. If person has 4 years, they earn 1.134 times more than no schooling
• Earlier years of schooling have higher returns as they teach the most important skills
• College premium rose even though supply of college educated workers increased due to rising demand for these people.
- Due to free trade & because tech change was skill based. Tech could replace low skilled but was a complement to high skilled (IT)
• 1/3 of GDP goes to owners of physical capital so 2/3 goes to labour
- We can find how much of this payment is for human capital & how much is for raw labour (if HC=0)
• E.g. a worker has 5 years of education and return to 5th year is 10% so the worker’s wage is 1.134 x
1.1=1.82 times as a person with no education. If the no education person earned $1 then $0.82 is the part
of the wage from human capital and $1 is the raw labour part
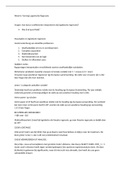
• Graph: solid line is for different levels of education, relative to none. Bottom 5% of LF have no HC
• Distance between solid and dashed is the part of the wage due to human capital.
- Total area above dashed line= total wages paid to human capital
- To find human capital’s share of GDP, multiply HC’s share of wages (≈65%) by 2/3
Education and the Variation in Income Across Countries
• Assume countries differ in the amount of labour input per worker (h)
• L number of workers to total labour input is Lh so Y = AKα(hL)1-α = h1-αAKαL1-α
• We get the steady state output per worker- it’s proportional to h so as h rises, yss rises
• To determine the effect of education on h, we can consider the wage.
- So a person with 1 year of schooling earns 1.13 times more
- We can say they supply 1.13 times more units of labour than with no education (denote as h0)
• Ratio between 2 countries: y1/y2=h1/h2
• If each unit of labour is paid a fixed amount, the wage earned is proportional to labour input h
• variation in education explains some of the variation in income per worker among countries
• Issue: quality of schooling varies between countries, so results understate the true difference in HC
• Issue 2: externalities mean that education raises individual’s output and the output of those around them, esp in poorer nations.
• Positive externality means underinvestment in education so government intervenes. Understates impact of HC in income differences
• HC will play less of a role in future as health is unlikely to keep improving and education can’t rise forever as we have to start working
, TFP
Accounting
• Productivity/TFP A is the effectiveness with which factors of production are converted into output.
- Countries differ in their accumulation of inputs and their productivity but we can only measure
• Y=AKα(hL)1-α & in per worker terms y = Akαh1-α, we write factors of production =kαh1-α
- So output= productivity x factors of production. Called development accounting
• Take logs for Growth accounting: y# = # ̂ + #αk# ̂ + (1 - #α)#ĥ for growth rate in per worker, weighted by elasticity
̂ A
• Can compare countries: ratio of output= Ratio of productivity x ratio of factors of production.
- The larger the ratio of factors, the smaller the productivity gap. But can’t measure A (it’s the residual)
• Among the richest 1/5 of countries, productivity and factor accumulation are of almost equal importance in
explaining the gap in income relative to US
- For poor countries factor accumulation is more important in explaining why country is poor
• Wider productivity growth range between rich and poor countries
• Productivity growth is far more important than factor growth in explaining variation in output growth rates
Hsieh and Klenow (2010): Development Accounting
• Fundamentals: geography, climate affects institutions and culture which affect policies and law
• Proximate causes of growth: from the Solow model A,K,L
- Found that K accounts for 20% of income differences, h is 10-30% and A is 50-70%
• Firm level TFP differences and misallocation of resources between firms affects relative TFP
between sectors which affects the physical capital and HC accumulation which then affects y
- Use Y=AKα(hL)1-α where L= labour supply not population i.e. workers times hours
• They find that the K/Y capital to output ratio is correlated with income level
• Why rich countries have a higher K/Y: theory suggests poor countries can’t save: risk of appropriation
- But results suggest not true: poor don’t have less investment when we consider in domestic prices
- PPP investment rate is I/Y but domestic price investment rate is PIxI/PY xY
• Maybe in poor countries, tradeable investment goods are more expensive: importing them (transport costs)
and trade barriers. But not supported: price of equipment is not higher so investment not more expensive
• Remaining reason is cheap consumption in poor countries so people don’t save and so can’t invest
- Since relative TFP in poor countries is lower in producing investment goods than consumption goods
- Less efficient for them to produce investment goods than consumption: lack the tech i.e. AC/AI>1
• Relative TFP matters: if higher for consumption goods, less investment and less physical capital accumulation
• HC investment higher in rich countries maybe as higher returns. But still high returns in poor countries.
• Not explained by Mincer Model (MC=MB). Higher TFP can reduce the cost of schooling relative to output
• Firm quality varies in economy affecting TFP: misallocation of labour and capital to inefficient/zombie firms
Technology
• In SS, k and y are constant but Y and K grow at n. Now we let A grow by a rate g
• Motion of capital: Kt+1=(1-𝛿)Kt+γYt . Divide by AtLt . Define k̃t= Kt/AtLt & ỹt= Yt/AtLt
• Kt+1/AtLt=(1-𝛿)Kt /AtLt+γYt/AtLt and manipulate [Kt+1/At+1Lt+1] [At+1Lt+1 /AtLt]=(1-𝛿)Kt /AtLt+γYt/AtLt
• So k̃t+1 (1+g)(1+n)=(1-𝛿)k̃t +γỹt but in SS k̃t+1 = k̃t = k̃ss so γỹss =(g+n+𝛿)k̃ss
• In the SS, k̃ss and ỹss are constant but kss=At k̃ss and yss=At ỹss grow at g (derived from k=K/L subbed in)
- Since tilda grows at 0 and A grows at g. So with tech progress, in the SS GDP per capita is unchanged
- Called exogenous growth model: rate of tech progress g is given
• Productivity= tech, efficiency and management. Tech allows us to escape diminishing returns to HC and K
• Gov supports R&D through tax breaks and patents (since tech is non-rival & partly non-excludable so need
incentive to invest)
• R&D determined by profit consideration (monopoly and supernormal profit but depends on size of market ,
patents, size of advantage and uncertainty over R&D) and creative destruction (new tech replaces old)
, TFP
Accounting
• Productivity/TFP A is the effectiveness with which factors of production are converted into output.
- Countries differ in their accumulation of inputs and their productivity but we can only measure
• Y=AKα(hL)1-α & in per worker terms y = Akαh1-α, we write factors of production =kαh1-α
- So output= productivity x factors of production. Called development accounting
# ̂ + #αk# ̂ + (1 - #α)#ĥ for growth rate in per worker, weighted by elasticity
̂ A
• Take logs for Growth accounting: y# =
• Can compare countries: ratio of output= Ratio of productivity x ratio of factors of production.
- The larger the ratio of factors, the smaller the productivity gap. But can’t measure A (it’s the residual)
• Among the richest 1/5 of countries, productivity and factor accumulation are of almost equal importance in
explaining the gap in income relative to US
- For poor countries factor accumulation is more important in explaining why country is poor
• Wider productivity growth range between rich and poor countries
• Productivity growth is far more important than factor growth in explaining variation in output growth rates
Hsieh and Klenow (2010): Development Accounting
• Proximate causes of growth: from the Solow model A,K,L
• Fundamentals: geography, climate affects institutions and culture which affect policies and law
• Found that K accounts for 20% of income differences, h is 10-30% and A is 50-70% of income difference
• Firm level TFP differences and misallocation of resources between firms affects relative TFP
between sectors which affects the physical capital and HC accumulation which then affects y
- Use Y=AKα(hL)1-α where L= labour supply not population i.e. workers times hours
• They find that the K/Y capital to output ratio is correlated with income level
• Why rich countries have a higher K/Y: theory may suggest as poor countries can’t save, risk of appropriation
• But results suggest not true: poor don’t have less investment when we consider in domestic prices
• Maybe in poor countries, tradeable investment goods are more expensive: importing them so transport costs
and trade barriers. But theory not supported: price of equipment is not higher so investment not more
expensive
• Remaining reason is cheap consumption in poor countries so people don’t save and so can’t invest
- Since relative TFP in poor countries is lower in producing investment goods than consumption goods
• Relative TFP matters: if higher for consumption goods, less investment and less physical capital accumulation
• HC investment higher in rich countries. But not explained by Mincer Model (MC=MB)
• Higher TFP can reduce the cost of schooling relative to output
Technology