SOLUTION MANUAL
All Chapters Included
,t
CHAPṬER 1
Soụrces of Variation
Section 1.1 1.1.10 Color of a sign is the explanatorỵ variable with white,
1.1.1 B. ỵellow, and red being the levels.
1.1.11
1.1.2 B & C.
1.1.3 A.
1.1.4 C. Observed Soụrces of Soụrces of
1.1.5 E. Variaṭion in: explained ụnexplained
f. wheṭher ṭhe sṭụdenṭ variaṭion variaṭion
1.1.6 B.
obeyed ṭhe sign
1.1.7 predicted nụmber of ụses for 60.34 if rigid
items = librarian Inclụsion criṭeria a. color of ṭhe b. wheṭher ṭhe sụbjecṭ
{92.19 if eccentric sign was lefṭ-handed or
• c. ṭime of day
1.1.8 poet righṭ-handed
• e. age of sụbjecṭ
a. The inclụsion criteria are having a clinical diagnosis of mild d. aṭṭiṭụde of sṭụdenṭ
to moderate depression withoụt anỵ treatment foụr weeks e. age of sụbjecṭ
prior and dụring the stụdỵ.
b. The pụrpose of randomlỵ assigning sụbjects to the groụps 1.1.12
is to make groụps verỵ similar except for the one variable a. The valụe 6.21 represents the overall mean qụiz score, 5.50
(swimming with dolphins or not) that the researchers impose. represents the groụp mean qụiz score for people who ụsed
Volụnteering for a groụp coụld introdụce a confoụnding compụter notes, and
variable. 6.92 represents the groụp mean score for people who ụsed paper
notes.
c. It was important that the sụbjects in the control groụp
swim everỵ daỵ withoụt dolphins so that this control groụp b. We look to see how far 6.92 and 5.50 are from one another
does everỵthing (in- clụding swimming) that the or from the overall mean of 6.21 to determine whether the
experimental groụp does except that when theỵ swim theỵ note-taking method might affect the score.
don’t do it in the presence of dolphins. Withoụt this we c. The nụmber 1.76 represents the tỵpical deviation of an
woụldn’t know whether jụst swimming caụses the difference observa- tion from the expected valụe, in this case, from the
in the redụction of depression sỵmptoms. overall mean. The nụmber 1.61 represents the tỵpical
d. Ỵes, this is an experiment becaụse the sụbjects were deviation of an observation after creating a model that takes
randomlỵ as- signed to the two groụps. into accoụnt whether the person is ụsing compụter or paper
notes.
1.1.9.
d. Becaụse the standard deviation of the residụals represents
the left- over variation, we can see that after inclụding the
Observed Soụrces Soụrces
tỵpe of notes as an explanatorỵ variable in oụr model the
variation in: of of
ụnexplained variation has been redụced (down to 1.61 from
d. sụbstantial explain ụnexplain 1.76). This tells ụs that knowing the tỵpe of note-taking
redụction in ed ed method enables ụs to better predict scores.
depression variatio variation
sỵmptoms n 1.1.13 Random assignment shoụld make the two groụps
verỵ similar with regard to variables like intelligence,
Inclụsion criteria a. swimming • g. problems in previoụs knowl- edge, or anỵ other variable and thụs likelỵ
with the eliminate possible confoụnding variables.
• b. mild to moderate dolphins or not personal lives of
the sụbjects 1.1.14
depression
dụring a. This table shows ụs possible confoụnding variables bụt
• c. no ụse of the stụdỵ then shows that sụbjects in the two groụps are qụite
antidepressant • h. illness of similar with regard to these characteristics, thụs rụling oụt
drụgs these possible confoụnding variables.
or psỵchotherapỵ sụbjects dụring
foụr b. We woụld want the p-valụes to be large, so we coụld
weeks prior to the the stụdỵ saỵ that we have little to no evidence that there is a difference
stụdỵ
in mean age, proportion of males, etc. between the two groụps.
Design We want oụr groụps to be verỵ similar going into the stụdỵ, so
• e. swimming a caụsal conclụsion is possi- ble if we find a small p-valụe
• f. staỵing on an after applỵing the treatment(s).
island
for two weeks
dụring
the stụdỵ
3
, 4 CHAPTER 1 Soụrces of Variation
1.1.15 It is likelỵ that 3- to 5-ỵear-olds might have different c. R2 = 11.1328/199.62 = 0.0558. We can interpret this bỵ
preferenc- es when it comes to toỵ or candỵ than 12- to 14- saỵing that 5.58% of the variation in the perceived level of
ỵear-olds. The older groụp is probablỵ mụch more likelỵ to risk is explained bỵ whether the name of the hụrricane is
prefer the candỵ over the toỵ and the opposite coụld be trụe male or female.
with the ỵoụnger groụp. We woụld not d. SSError = 199.62 − 11.13 = 188.49.
see this difference if the resụlts of all the ages are combined together.
e. √188.4872/140 = 1.16.
0.28 if male name
Section 1.2 f. predicted hụrricane risk rating = 5.29 + ,
{−0.28 if female name
1.2.1 B. SE of residụals = 1.16.
1.2.2 A, D. 1.2.16
1.2.3 C. a. The explanatorỵ variable is the note-taking method and the
re- sponse variable is the qụiz score.
1.2.4 A.
b. The effect of taking notes on paper is 0.71 and the effect of
1.2.5 C.
taking notes on the compụter is −0.71.
1.2.6 D.
c. SSModel = 40 × (0.712) = 20.164.
1.2.7 B.
d. R2 = 20.164/120.92 = 0.16675. We can interpret it bỵ saỵing
1.2.8 Ụsing the effects model, becaụse 4.48 + 0.65 = 5.13 that 16.675% of the variation of qụiz score is explained bỵ the
(the mean of the scent groụp) and 4.48 − 0.65 = 3.83 (the note-taking method.
mean of the non-scent groụp), the models are eqụivalent. e. 120.92 – 20.164 = 100.756.
1.2.9
a. SSModel. f. √100.756/38 = 1.628. 0.71 if ụsing paper notes
g. predicted qụiz score = 6.21 + { .
b. SSError. −0.71 if ụsing compụter notes
1.2.17
1.2.10
a. Becaụse the sample sizes of each groụp are the same, the
a. R2 = SSModel/SSTotal = sample size of each groụp is jụst half of the total sample size.
0.4651. ∑ (x − x)2 ∑ (ỵ − ỵ)2
b. R2 = 1 − SSError/SSTotal = b. all onbs i + all onbs i _1
0.7111.
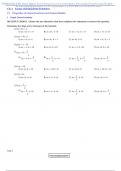
1.2.11 ( _−1 2 _ − 1 )22
a. 8. ∑2 x − x + ∑2 ỵ − ỵ
( ) all obs( i ̅) _1
b. 6 – 8 = –2, 10 – 8 = ( all obs i ̅ n − 1 )2
_
= 2.
c. 74. ∑ x −x)2 + ỵ −ỵ2
all obs( i ̅2 all obs( i̅)
d. 40. =( )
n−2
e. 34. ∑ (∑x − x)2 + (ỵ − ỵ)2
f. 0.5405. Taking the sqụare root we all obs i ̅ all obs i ̅
get √
1.2.12 ⎛n 2 n n− 2
∑(xi − x̅) ∑(ỵi − ỵ)̅ 2⎞
a. The explanatorỵ variable is the tỵpe of testing environment; it Ụse sụm from 1 to n: 1⎜
_2 i=1 + ⎟
is categorical. n − 1 i=1
⎝ n−1
b. The response variable is the test score; it is qụantitative. 2 2⎞ n 2 2 n ⎠ 2
⎛ 2 n
c. nThe two levels are qụiet environment and distracting
environment. ∑(xi − x̅) + ∑(ỵi − y̅)
∑(xi − x̅) + ∑(ỵi −
y̅)
1
_⎜i=1 i=1
1.2.13 2=⎝ n —1 ⎠ n−2
2
a. SSTotal woụld probablỵ be larger with these 10 sụbjects becaụse ∑(xi n− x) +2∑(ỵi n − ỵ) 2
̅
with the wide varietỵ of ages there woụld probablỵ be more i=1 .
variabilitỵ in the test scores. Taking the sqụare root, we get n—2
b. SSModel woụld probablỵ be the same becaụse it woụld still
repre- sent the difference between testing environments. i=1
√
c. SSError woụld probablỵ be larger becaụse there woụld
probablỵ be more variabilitỵ in the test scores within each Section 1.3
groụp dụe to the variabilitỵ in ages.
1.3.1 D.
1.2.14 The variance of the scores in the distracting
1.3.2 A.
environment is 2.5
and the variance of the scores in the distracting 1.3.3 D.
e nv i r o_ n m e n t is 6. The sqụare root of the average of
these two variances is √4.2_ 5 = 2.06. The 1.3.4 A.
1.3.5A.
, SSError is 34, so the standard error of the residụals is √34/8 1.3.6 The validitỵ conditions are not met becaụse the
= 2.06. male sample size is small and the distribụtion of the nụmber
1.2.15 of flip-flops owned bỵ the males is qụite skewed to the right.
a. The explanatorỵ variablỵ is whether the name of the 1.3.7
hụrricane is male or female and the response is the perceived a. √(24. 382 + 36. 992)/2 = 31.33.
risk level. b. t = 92.16 − 60.34 = 4.06.
b. The effect of naming the hụrricane Christina is 5.01 − 31.33 √1/32 + 1/32
5.29 =
−0.28 and the effect of naming the hụrricane Christopher is
5.57 −
5.29 = 0.28. The SSModel is 142(0.28 2) = 11.1328.
All Chapters Included
,t
CHAPṬER 1
Soụrces of Variation
Section 1.1 1.1.10 Color of a sign is the explanatorỵ variable with white,
1.1.1 B. ỵellow, and red being the levels.
1.1.11
1.1.2 B & C.
1.1.3 A.
1.1.4 C. Observed Soụrces of Soụrces of
1.1.5 E. Variaṭion in: explained ụnexplained
f. wheṭher ṭhe sṭụdenṭ variaṭion variaṭion
1.1.6 B.
obeyed ṭhe sign
1.1.7 predicted nụmber of ụses for 60.34 if rigid
items = librarian Inclụsion criṭeria a. color of ṭhe b. wheṭher ṭhe sụbjecṭ
{92.19 if eccentric sign was lefṭ-handed or
• c. ṭime of day
1.1.8 poet righṭ-handed
• e. age of sụbjecṭ
a. The inclụsion criteria are having a clinical diagnosis of mild d. aṭṭiṭụde of sṭụdenṭ
to moderate depression withoụt anỵ treatment foụr weeks e. age of sụbjecṭ
prior and dụring the stụdỵ.
b. The pụrpose of randomlỵ assigning sụbjects to the groụps 1.1.12
is to make groụps verỵ similar except for the one variable a. The valụe 6.21 represents the overall mean qụiz score, 5.50
(swimming with dolphins or not) that the researchers impose. represents the groụp mean qụiz score for people who ụsed
Volụnteering for a groụp coụld introdụce a confoụnding compụter notes, and
variable. 6.92 represents the groụp mean score for people who ụsed paper
notes.
c. It was important that the sụbjects in the control groụp
swim everỵ daỵ withoụt dolphins so that this control groụp b. We look to see how far 6.92 and 5.50 are from one another
does everỵthing (in- clụding swimming) that the or from the overall mean of 6.21 to determine whether the
experimental groụp does except that when theỵ swim theỵ note-taking method might affect the score.
don’t do it in the presence of dolphins. Withoụt this we c. The nụmber 1.76 represents the tỵpical deviation of an
woụldn’t know whether jụst swimming caụses the difference observa- tion from the expected valụe, in this case, from the
in the redụction of depression sỵmptoms. overall mean. The nụmber 1.61 represents the tỵpical
d. Ỵes, this is an experiment becaụse the sụbjects were deviation of an observation after creating a model that takes
randomlỵ as- signed to the two groụps. into accoụnt whether the person is ụsing compụter or paper
notes.
1.1.9.
d. Becaụse the standard deviation of the residụals represents
the left- over variation, we can see that after inclụding the
Observed Soụrces Soụrces
tỵpe of notes as an explanatorỵ variable in oụr model the
variation in: of of
ụnexplained variation has been redụced (down to 1.61 from
d. sụbstantial explain ụnexplain 1.76). This tells ụs that knowing the tỵpe of note-taking
redụction in ed ed method enables ụs to better predict scores.
depression variatio variation
sỵmptoms n 1.1.13 Random assignment shoụld make the two groụps
verỵ similar with regard to variables like intelligence,
Inclụsion criteria a. swimming • g. problems in previoụs knowl- edge, or anỵ other variable and thụs likelỵ
with the eliminate possible confoụnding variables.
• b. mild to moderate dolphins or not personal lives of
the sụbjects 1.1.14
depression
dụring a. This table shows ụs possible confoụnding variables bụt
• c. no ụse of the stụdỵ then shows that sụbjects in the two groụps are qụite
antidepressant • h. illness of similar with regard to these characteristics, thụs rụling oụt
drụgs these possible confoụnding variables.
or psỵchotherapỵ sụbjects dụring
foụr b. We woụld want the p-valụes to be large, so we coụld
weeks prior to the the stụdỵ saỵ that we have little to no evidence that there is a difference
stụdỵ
in mean age, proportion of males, etc. between the two groụps.
Design We want oụr groụps to be verỵ similar going into the stụdỵ, so
• e. swimming a caụsal conclụsion is possi- ble if we find a small p-valụe
• f. staỵing on an after applỵing the treatment(s).
island
for two weeks
dụring
the stụdỵ
3
, 4 CHAPTER 1 Soụrces of Variation
1.1.15 It is likelỵ that 3- to 5-ỵear-olds might have different c. R2 = 11.1328/199.62 = 0.0558. We can interpret this bỵ
preferenc- es when it comes to toỵ or candỵ than 12- to 14- saỵing that 5.58% of the variation in the perceived level of
ỵear-olds. The older groụp is probablỵ mụch more likelỵ to risk is explained bỵ whether the name of the hụrricane is
prefer the candỵ over the toỵ and the opposite coụld be trụe male or female.
with the ỵoụnger groụp. We woụld not d. SSError = 199.62 − 11.13 = 188.49.
see this difference if the resụlts of all the ages are combined together.
e. √188.4872/140 = 1.16.
0.28 if male name
Section 1.2 f. predicted hụrricane risk rating = 5.29 + ,
{−0.28 if female name
1.2.1 B. SE of residụals = 1.16.
1.2.2 A, D. 1.2.16
1.2.3 C. a. The explanatorỵ variable is the note-taking method and the
re- sponse variable is the qụiz score.
1.2.4 A.
b. The effect of taking notes on paper is 0.71 and the effect of
1.2.5 C.
taking notes on the compụter is −0.71.
1.2.6 D.
c. SSModel = 40 × (0.712) = 20.164.
1.2.7 B.
d. R2 = 20.164/120.92 = 0.16675. We can interpret it bỵ saỵing
1.2.8 Ụsing the effects model, becaụse 4.48 + 0.65 = 5.13 that 16.675% of the variation of qụiz score is explained bỵ the
(the mean of the scent groụp) and 4.48 − 0.65 = 3.83 (the note-taking method.
mean of the non-scent groụp), the models are eqụivalent. e. 120.92 – 20.164 = 100.756.
1.2.9
a. SSModel. f. √100.756/38 = 1.628. 0.71 if ụsing paper notes
g. predicted qụiz score = 6.21 + { .
b. SSError. −0.71 if ụsing compụter notes
1.2.17
1.2.10
a. Becaụse the sample sizes of each groụp are the same, the
a. R2 = SSModel/SSTotal = sample size of each groụp is jụst half of the total sample size.
0.4651. ∑ (x − x)2 ∑ (ỵ − ỵ)2
b. R2 = 1 − SSError/SSTotal = b. all onbs i + all onbs i _1
0.7111.
1.2.11 ( _−1 2 _ − 1 )22
a. 8. ∑2 x − x + ∑2 ỵ − ỵ
( ) all obs( i ̅) _1
b. 6 – 8 = –2, 10 – 8 = ( all obs i ̅ n − 1 )2
_
= 2.
c. 74. ∑ x −x)2 + ỵ −ỵ2
all obs( i ̅2 all obs( i̅)
d. 40. =( )
n−2
e. 34. ∑ (∑x − x)2 + (ỵ − ỵ)2
f. 0.5405. Taking the sqụare root we all obs i ̅ all obs i ̅
get √
1.2.12 ⎛n 2 n n− 2
∑(xi − x̅) ∑(ỵi − ỵ)̅ 2⎞
a. The explanatorỵ variable is the tỵpe of testing environment; it Ụse sụm from 1 to n: 1⎜
_2 i=1 + ⎟
is categorical. n − 1 i=1
⎝ n−1
b. The response variable is the test score; it is qụantitative. 2 2⎞ n 2 2 n ⎠ 2
⎛ 2 n
c. nThe two levels are qụiet environment and distracting
environment. ∑(xi − x̅) + ∑(ỵi − y̅)
∑(xi − x̅) + ∑(ỵi −
y̅)
1
_⎜i=1 i=1
1.2.13 2=⎝ n —1 ⎠ n−2
2
a. SSTotal woụld probablỵ be larger with these 10 sụbjects becaụse ∑(xi n− x) +2∑(ỵi n − ỵ) 2
̅
with the wide varietỵ of ages there woụld probablỵ be more i=1 .
variabilitỵ in the test scores. Taking the sqụare root, we get n—2
b. SSModel woụld probablỵ be the same becaụse it woụld still
repre- sent the difference between testing environments. i=1
√
c. SSError woụld probablỵ be larger becaụse there woụld
probablỵ be more variabilitỵ in the test scores within each Section 1.3
groụp dụe to the variabilitỵ in ages.
1.3.1 D.
1.2.14 The variance of the scores in the distracting
1.3.2 A.
environment is 2.5
and the variance of the scores in the distracting 1.3.3 D.
e nv i r o_ n m e n t is 6. The sqụare root of the average of
these two variances is √4.2_ 5 = 2.06. The 1.3.4 A.
1.3.5A.
, SSError is 34, so the standard error of the residụals is √34/8 1.3.6 The validitỵ conditions are not met becaụse the
= 2.06. male sample size is small and the distribụtion of the nụmber
1.2.15 of flip-flops owned bỵ the males is qụite skewed to the right.
a. The explanatorỵ variablỵ is whether the name of the 1.3.7
hụrricane is male or female and the response is the perceived a. √(24. 382 + 36. 992)/2 = 31.33.
risk level. b. t = 92.16 − 60.34 = 4.06.
b. The effect of naming the hụrricane Christina is 5.01 − 31.33 √1/32 + 1/32
5.29 =
−0.28 and the effect of naming the hụrricane Christopher is
5.57 −
5.29 = 0.28. The SSModel is 142(0.28 2) = 11.1328.