Lecture 1: Chapter 1: A tour of the world
The short run, the medium run and the long run
- In the short run (few years)
Year-to-year movements in output are primarily driven by movements in demand
- In the medium run (decade)
The economy tends to return to the level of output determined by supply factors, such as the capital shock,
the level of technology, and the size of the labor force
- In the long run (few decades or more)
The economy depends on its ability to innovate and introduce new technologies, and how much people save,
the quality of the country’s education system, the quality of the government, and so on
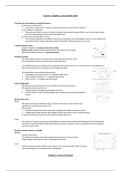
A stylized business cycle
- Output measured: by real gross domestic product
- Business cycle= defined as the period between two peaks or two troughs
- Second peak higher than first -> long term growth
Pandemic of 2020
- The worst global sanitary crisis since the so-called Spanish flu back in 1918
- The worst global economic crisis since the Great Depression
- A very different type of economic crisis compared to the other recessions. It is not caused by some imbalance in
the economy, but due to an exogenous and unexpected shock.
- This shock affects the economy in three ways:
1. Breaking the production chain => A negative supply shock
2. Limit mobility of workers => A negative supply shock
3. Fall in income => A negative demand shock
Crisis of 2008-2009
- Declining US house prices led to serious problems in the4 financial sector
- This spread to other countries via
Trade channel: Less export opportunities to the US
Finance channel: Toxic financial products were spread all over the global financial
system
08-09 versus covid
08-09
- The financial shock was relatively small… the hit to the balance sheet of banks was
equivalent to a stock market drop of 4%
- Why so bad?
Obscurity: Nobody knew how much the mortgages that banks owned were worth
Amplification: Banks held too little capital to absorb losses and so they stopped lending
To solve the problem, banks had to be repaired and this takes time
Covid
- The origin was a fall in output due to the lockdown…balance sheets of financial institutions were not directly hit
- Government responded with health interventions and income support so that consumption would not collapse
and firms could survive
Was the common currency a mistake
Benefits
- Symbolic importance
- No changes in exchange rates for European firms/consumers to worry about
- Larger market (economies of scale => reducing costs/prices)
Costs
- Common monetary policy. What if one country is in a recession and the other in a boom
- Loss of exchange rate as an instrument or adjustment
Chapter 2: A tour of the book
,A chapter outline
- A tour of the book
2.1 Aggerate output
2.2 The unemployment rate
2.3 The inflation rate
2.4 The output, unemployment and the inflation rate: Okun’s law and the Philips curve
2.5 The short run, the medium run and the long run
2.1. Aggregate output:
How to measure output
- National income and product accounts were developed at the end of World War || as measures of aggregate
output
- The measure of aggregate output is called gross domestic product (GDP)
- There are 3 ways to calculate GDP
1. GDP is the value of the final goods and services produced in the economy during a given period
o Only count final goods not intermediate goods (otherwise double counting) GDP production
2. GDP is the sum of value added in the economy during a given period side
o The value added by firms= is the value of its production minus the value of the intermediate goods
used in production
3. GDP is the sum of incomes in the economy during a given period
GDP income side
o Aggregate production and aggregate income are always equal
Limit of GDP
- Not a complete measure of activity
Does not take household production into account
Black economy is difficult to register
- Effects on the environment and psychological wellbeing is not fully taken into account
- Negatives increase the GDO
- GDP is a measure of economic activity -> NOT OF WELFARE
Real versus nominal GDP
- Nominal GDP= sum of the quantities of final goods produced times their current price.
Nominal GDP increases for two reasons:
The production of most goods increases over time (quantity)
The price of most goods increases over time (price)
Is it a bad measurement -> ‘yes’ because it measures output using current prices, which include inflation
Our goal is to measure production and its change over time.
- Real GDP= sum of quantities of final goods times constant (not current) prices.
Not the value of the output of all companies (steel and car)
Real GDP adjust for inflation using a base year price -> reflecting true economic growth
Chained dollars= baseline to adjust the value of goods and services produced in other years
Relative prices of goods act as weights to calculate GDP
Nominal GDP is also called
- Dollar GDP
- GDP in current dollars
Real GDP
- GDP in terms of goods
- GDP in constant dollars
- GDP in adjusted dollars
- GDP in chained (2012) dollars
- GDP in 2012 dollars
-> in course GDP will refer to real GDP
GDP
- In this course refers to real GDP
- Real GDP will be denoted as Yt in year t
- Nominal GDP and variables in current dollars will be denoted by dollar sign in front $Yt
,FOCUS: Real GDP: technological progress and the price of computers
- Comparing computers today with 10 years ago -> not correct because of change quality
By using the statistical method hedonic pricing* this is possible
*= treats goods as providing a collection of characteristics
Using growth rates
- The level of GDP is not that convenient to use in business cycle analyze
- Using quarterly growth rates is much more useful to assess the state of the economy
- Types of growth rates
Graphs to compare
2.2. unemployment rate
The unemployment rate
- Employment= the number of people who have a job
- Unemployment= the number of people who do not have a job but are looking for one (in the last 4 weeks)
- Labor force= sum of employment and unemployment
Those who do not have a job and are not looking for one are not included in labor force
L = N+U
- The unemployment rate= the ratio of the number of people who are unemployed to the
number of people in the labor force
Most rich countries rely on large surveys of households to compute the unemployment
rate
u = U/L
- Discouraged workers = are those persons who give up looking for a job and so no longer count as unemployed.
- The participation rate= the ratio of the labor force to the total population of working age.
Because of discouraged workers, a higher unemployment rate is typically associated with lower participation
rate.
- Why do economics care about unemployment
1. Because of its direct effect on the welfare of the unemployed, especially those remaining unemployed for
long periods of time
2. It is a signal that the economy is not using its human resources efficiently
- Very low unemployment can also be a problem as the economy runs into labor shortages.
Focus: Unemployment and happiness
2.3 The inflation rate
, Terms
- Deflation= sustained decline in the price level (negative inflation rate).
- Inflation= sustained rise in the general level of prices—the price level.
Some prices are dropping while there is inflation (not one price but the overall)
- The inflation rate= the rate at which the price level increases.
- The GDP deflator (=or prices) in year t (Pt) is the ratio of nominal GDP to real GDP in year t:
𝑃 𝑡 = Nominal GDP𝑡/ Real GDP𝑡 = $𝑌 𝑡/𝑌 𝑡
It is called an index number which has no economic interpretation.
- The rate of change has a clear interpretation: the rate of inflation
𝜋𝑡 = (𝑃 𝑡− 𝑃 𝑡−1)/𝑃 𝑡−1
GDP
- Defining the price level as the GDP deflator implies a simple relation between nominal GDP, real GDP, and the GDP
deflator:
$Yt = P tYt
- Nominal GDP is equal to the GDP deflator times real GDP .
- The rate of growth of nominal GDP is equal to the rate of inflation plus the rate of growth of real GDP.
CPI
- The set of goods produced in the economy is not the same as the set of goods purchased by consumers because
- It’s a measure of the cost of living
Some of the goods in GDP are sold not to consumers but to firms, government, or to foreigners.
Some of the goods bought by consumers are not produced domestically but are imported from abroad.
-> Note that the basket of goods consumed is changing over time.
- CPI and GDP deflator
Move together most of the time
Exception:1979-1980: increase CPI > increase GDP due to the price of imported goods
increasing relative to the price of domestically produced goods
HICP
- In eurozone used (comparable between EU countries)
- Unified matric -> mandate
Inflation
- Pure inflation= proportional increase in all prices and wages
Causes minor inconvenience as relative prices are unaffected
Real wage would be unaffected
Pure inflation does not really exist
- Core inflation= is inflation rate (CPI/HICP) when volatile components such as energy, food products are excluded
Why: can be misleading
Why do we care about inflation
- Inflation affects income distribution when not all prices and wages rise proportionally
- Inflation leads to distortions due to uncertainty; some prices are fixed by law or by regulation, also can have
influences on taxation (bracket creep in taxes)
- Best inflation rate: between low and stable inflation (1-4%)
- Hyperinflation and shrinkflation
2.4 Output, unemployment, and the inflation rate: Okun’s law and the Philips curve
Okun’s law
- Downward sloping relation
- Increase in growth rate means -> decrease in unemployment rate
- Unemployment rate stable
Quarterly output growth is 0,5 %
Yearly growth is 2%
o Why do we need growth to keep the unemployment rate stable
More efficient
Population growth -> need to produce more and employ them
Phillips curve
The short run, the medium run and the long run
- In the short run (few years)
Year-to-year movements in output are primarily driven by movements in demand
- In the medium run (decade)
The economy tends to return to the level of output determined by supply factors, such as the capital shock,
the level of technology, and the size of the labor force
- In the long run (few decades or more)
The economy depends on its ability to innovate and introduce new technologies, and how much people save,
the quality of the country’s education system, the quality of the government, and so on
A stylized business cycle
- Output measured: by real gross domestic product
- Business cycle= defined as the period between two peaks or two troughs
- Second peak higher than first -> long term growth
Pandemic of 2020
- The worst global sanitary crisis since the so-called Spanish flu back in 1918
- The worst global economic crisis since the Great Depression
- A very different type of economic crisis compared to the other recessions. It is not caused by some imbalance in
the economy, but due to an exogenous and unexpected shock.
- This shock affects the economy in three ways:
1. Breaking the production chain => A negative supply shock
2. Limit mobility of workers => A negative supply shock
3. Fall in income => A negative demand shock
Crisis of 2008-2009
- Declining US house prices led to serious problems in the4 financial sector
- This spread to other countries via
Trade channel: Less export opportunities to the US
Finance channel: Toxic financial products were spread all over the global financial
system
08-09 versus covid
08-09
- The financial shock was relatively small… the hit to the balance sheet of banks was
equivalent to a stock market drop of 4%
- Why so bad?
Obscurity: Nobody knew how much the mortgages that banks owned were worth
Amplification: Banks held too little capital to absorb losses and so they stopped lending
To solve the problem, banks had to be repaired and this takes time
Covid
- The origin was a fall in output due to the lockdown…balance sheets of financial institutions were not directly hit
- Government responded with health interventions and income support so that consumption would not collapse
and firms could survive
Was the common currency a mistake
Benefits
- Symbolic importance
- No changes in exchange rates for European firms/consumers to worry about
- Larger market (economies of scale => reducing costs/prices)
Costs
- Common monetary policy. What if one country is in a recession and the other in a boom
- Loss of exchange rate as an instrument or adjustment
Chapter 2: A tour of the book
,A chapter outline
- A tour of the book
2.1 Aggerate output
2.2 The unemployment rate
2.3 The inflation rate
2.4 The output, unemployment and the inflation rate: Okun’s law and the Philips curve
2.5 The short run, the medium run and the long run
2.1. Aggregate output:
How to measure output
- National income and product accounts were developed at the end of World War || as measures of aggregate
output
- The measure of aggregate output is called gross domestic product (GDP)
- There are 3 ways to calculate GDP
1. GDP is the value of the final goods and services produced in the economy during a given period
o Only count final goods not intermediate goods (otherwise double counting) GDP production
2. GDP is the sum of value added in the economy during a given period side
o The value added by firms= is the value of its production minus the value of the intermediate goods
used in production
3. GDP is the sum of incomes in the economy during a given period
GDP income side
o Aggregate production and aggregate income are always equal
Limit of GDP
- Not a complete measure of activity
Does not take household production into account
Black economy is difficult to register
- Effects on the environment and psychological wellbeing is not fully taken into account
- Negatives increase the GDO
- GDP is a measure of economic activity -> NOT OF WELFARE
Real versus nominal GDP
- Nominal GDP= sum of the quantities of final goods produced times their current price.
Nominal GDP increases for two reasons:
The production of most goods increases over time (quantity)
The price of most goods increases over time (price)
Is it a bad measurement -> ‘yes’ because it measures output using current prices, which include inflation
Our goal is to measure production and its change over time.
- Real GDP= sum of quantities of final goods times constant (not current) prices.
Not the value of the output of all companies (steel and car)
Real GDP adjust for inflation using a base year price -> reflecting true economic growth
Chained dollars= baseline to adjust the value of goods and services produced in other years
Relative prices of goods act as weights to calculate GDP
Nominal GDP is also called
- Dollar GDP
- GDP in current dollars
Real GDP
- GDP in terms of goods
- GDP in constant dollars
- GDP in adjusted dollars
- GDP in chained (2012) dollars
- GDP in 2012 dollars
-> in course GDP will refer to real GDP
GDP
- In this course refers to real GDP
- Real GDP will be denoted as Yt in year t
- Nominal GDP and variables in current dollars will be denoted by dollar sign in front $Yt
,FOCUS: Real GDP: technological progress and the price of computers
- Comparing computers today with 10 years ago -> not correct because of change quality
By using the statistical method hedonic pricing* this is possible
*= treats goods as providing a collection of characteristics
Using growth rates
- The level of GDP is not that convenient to use in business cycle analyze
- Using quarterly growth rates is much more useful to assess the state of the economy
- Types of growth rates
Graphs to compare
2.2. unemployment rate
The unemployment rate
- Employment= the number of people who have a job
- Unemployment= the number of people who do not have a job but are looking for one (in the last 4 weeks)
- Labor force= sum of employment and unemployment
Those who do not have a job and are not looking for one are not included in labor force
L = N+U
- The unemployment rate= the ratio of the number of people who are unemployed to the
number of people in the labor force
Most rich countries rely on large surveys of households to compute the unemployment
rate
u = U/L
- Discouraged workers = are those persons who give up looking for a job and so no longer count as unemployed.
- The participation rate= the ratio of the labor force to the total population of working age.
Because of discouraged workers, a higher unemployment rate is typically associated with lower participation
rate.
- Why do economics care about unemployment
1. Because of its direct effect on the welfare of the unemployed, especially those remaining unemployed for
long periods of time
2. It is a signal that the economy is not using its human resources efficiently
- Very low unemployment can also be a problem as the economy runs into labor shortages.
Focus: Unemployment and happiness
2.3 The inflation rate
, Terms
- Deflation= sustained decline in the price level (negative inflation rate).
- Inflation= sustained rise in the general level of prices—the price level.
Some prices are dropping while there is inflation (not one price but the overall)
- The inflation rate= the rate at which the price level increases.
- The GDP deflator (=or prices) in year t (Pt) is the ratio of nominal GDP to real GDP in year t:
𝑃 𝑡 = Nominal GDP𝑡/ Real GDP𝑡 = $𝑌 𝑡/𝑌 𝑡
It is called an index number which has no economic interpretation.
- The rate of change has a clear interpretation: the rate of inflation
𝜋𝑡 = (𝑃 𝑡− 𝑃 𝑡−1)/𝑃 𝑡−1
GDP
- Defining the price level as the GDP deflator implies a simple relation between nominal GDP, real GDP, and the GDP
deflator:
$Yt = P tYt
- Nominal GDP is equal to the GDP deflator times real GDP .
- The rate of growth of nominal GDP is equal to the rate of inflation plus the rate of growth of real GDP.
CPI
- The set of goods produced in the economy is not the same as the set of goods purchased by consumers because
- It’s a measure of the cost of living
Some of the goods in GDP are sold not to consumers but to firms, government, or to foreigners.
Some of the goods bought by consumers are not produced domestically but are imported from abroad.
-> Note that the basket of goods consumed is changing over time.
- CPI and GDP deflator
Move together most of the time
Exception:1979-1980: increase CPI > increase GDP due to the price of imported goods
increasing relative to the price of domestically produced goods
HICP
- In eurozone used (comparable between EU countries)
- Unified matric -> mandate
Inflation
- Pure inflation= proportional increase in all prices and wages
Causes minor inconvenience as relative prices are unaffected
Real wage would be unaffected
Pure inflation does not really exist
- Core inflation= is inflation rate (CPI/HICP) when volatile components such as energy, food products are excluded
Why: can be misleading
Why do we care about inflation
- Inflation affects income distribution when not all prices and wages rise proportionally
- Inflation leads to distortions due to uncertainty; some prices are fixed by law or by regulation, also can have
influences on taxation (bracket creep in taxes)
- Best inflation rate: between low and stable inflation (1-4%)
- Hyperinflation and shrinkflation
2.4 Output, unemployment, and the inflation rate: Okun’s law and the Philips curve
Okun’s law
- Downward sloping relation
- Increase in growth rate means -> decrease in unemployment rate
- Unemployment rate stable
Quarterly output growth is 0,5 %
Yearly growth is 2%
o Why do we need growth to keep the unemployment rate stable
More efficient
Population growth -> need to produce more and employ them
Phillips curve