Quantitatif Guides d'étude, Notes de cours & Résumés
Vous recherchez les meilleurs guides d'étude, notes d'étude et résumés sur Quantitatif ? Sur cette page, vous trouverez 16 documents pour vous aider à réviser pour Quantitatif.
All 16 résultats
Trier par
-
GRE Quantitative Reasoning Prep.GRE recertification questions and answers
- Examen • 15 pages • 2023
- 13,73 €
- + en savoir plus
GRE Quantitative Reasoning Prep.

-
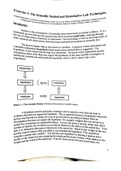
The scientific method for quantitative lab tehcniques
- Autre • 7 pages • 2023
- 10,13 €
- + en savoir plus
Science is the accumulation of knowledge about nature based on factual evidence. It is a systematic process dealing with questions that can be answered empirically through observations and experiments.
-
RN COMPREHENSIVE PREDICTOR 2019 FORM B An obstetrical nurse wishes to identify whether clients’ perceptions of a high level of support from their partner is associated with a decreased length of the second stage of labor. Which type of quantitative rese
- Examen • 9 pages • 2024
- 8,52 €
- + en savoir plus
RN COMPREHENSIVE PREDICTOR 2019 FORM B An obstetrical nurse wishes to identify whether clients’ perceptions of a high level of support from their partner is associated with a decreased length of the second stage of labor. Which type of quantitative research is most appropriate 1. for this research question? A) Correlational research B) Descriptive research C) Quasi-experimental research D) Experimental research Ans: A Feedback: Correlational quantitative research is used to examin...
-
What types of information would help you identify a research study as quantitative? (Select all that apply.) Correct B. What type of literature may a systematic review include to be considered Level 1 evidence on the Melnyk & Fineout-Overholt l
- Examen • 6 pages • 2022
- 14,68 €
- + en savoir plus
What types of information would help you identify a research study as quantitative? (Select all that apply.) Correct B. What type of literature may a systematic review include to be considered Level 1 evidence on the Melnyk & Fine out-Overholt levels of evidence hierarchy? Correct F. Answer: Randomized controlled


-
WK2Assgn.DraytonS.docx Quantitative Analysis: Visually Displaying Data Results RSCH 8210 A-Quantitative Reasoning and Analysis Walden University 14:48:34 GMT -05:00 The high school longitudinal study data set was used to identify two variables and
- Resume • 5 pages • 2022
- 7,10 €
- + en savoir plus
WK2Assgn.DraytonS.docx Quantitative Analysis: Visually Displaying Data Results RSCH 8210 A-Quantitative Reasoning and Analysis Walden University 14:48:34 GMT -05:00 The high school longitudinal study data set was used to identify two variables and visually display them for comparison. In order to visually display each variable a graph of some sort is needed. The mean of the variable X1SES (Socio-economic status composite) is .0355 displayed below in figure 1. Figure 1 The analyzation o...
-
WK1AssgnSessionWillisB.docx Variables, Measurement, and SPSS RSCH 8210: Quantitative Reasoning Module 1 14:03:25 GMT -05:00 Variables, Measurement, and SPSS For this assignment, the researcher analyzed the Afrobarometer dataset. To identify the m
- Resume • 4 pages • 2022
- 7,10 €
- + en savoir plus
WK1AssgnSessionWillisB.docx Variables, Measurement, and SPSS RSCH 8210: Quantitative Reasoning Module 1 14:03:25 GMT -05:00 Variables, Measurement, and SPSS For this assignment, the researcher analyzed the Afrobarometer dataset. To identify the mean of Q1 (Age), the researcher set SPSS to Variable View, selected Q1, and ran the descriptive statistics. The results displayed the mean of Q1 (Age) as 37.17. In this dataset, the researcher chose the variables Q101 (Gender of respondents) and...
-
WK6Assgn.docx RSCH 8210 Testing Hypotheses for Means RSCH 8210 Quantitative Reasoning and Analysis Testing Hypotheses for Means Three variations to t-tests were identified by Frankfort-Nachmias & Leon-Guerrero (2015), independent t-test, paired sampl
- Resume • 6 pages • 2021
- 7,10 €
- + en savoir plus
WK6A RSCH 8210 Testing Hypotheses for Means RSCH 8210 Quantitative Reasoning and Analysis Testing Hypotheses for Means Three variations to t-tests were identified by Frankfort-Nachmias & Leon-Guerrero (2015), independent t-test, paired sample t-test, and one sample t-test. These three scenarios will represent each of the t-tests. Scenario 1 This scenario regarding African Citizens perceptions regarding current democracy levels is a sample t-test. It focuses on the comparison before and af...
