2IAB0: Data analytics 2018
Week 1: EDA
EDA = Exploratory Data Analysis
Key features:
- Emphasis on getting to know the data
- Generate questions
- Extensive use of graphs
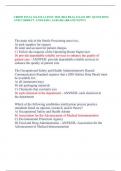
Data analytics life cycle:
Problem statement: problem that you are trying to solve
Organize data in a clear way
Clean: check whether the data is OK, if there are any wrong values, they should be removed
Transform: get specific info out of the dataset such as minimum, maximum and average.
Statistics: can be used to draw conclusions about data data over a larger period of time.
Visualize: useful tool to present insight of data
Mine: offers tools to investigate relationships between variables of datasets.
Communication: get the results of the data across to other people
Descriptive data analytics: insight into the past.
Predictive data analytics: looking into the future.
Prescriptive data analytics: advices on how to influence the future.
Tables:
- Good for reading off values
- Draw attention to actual sizes
2 types of tables:
1. Reference table: all data stored in it, easy to look up data
2. Demonstration table: present just enough data to illustrate a point
Data types:
Categorical:
o Dichotomous: yes/no, male/female
o Nominal: movie genre, no ordering
o Ordinal: ratings; bad/neutral/good
Numerical:
o Interval: no fixed zero point so only difference has a meaning such as temperature, pH-
value
o Ratio: has fixed zero point, budget, weight, length
,Graphs:
Dot plots/strip plots
- showing actual values/structure of numerical variables
- not suitable for large data sets
Histogram
- easily judge distributional properties like (a)symmetry
- distribution of numerical data
- sensitive to bin width
- choosing number of bins: √ n met n het aantal observaties
- no gaps between the bars
Bar chart
- gaps between the bars
- distribution of categorical data
KDP: kernel density plot
- improved histogram
- uses moving bins instead of fixed bins; disadvantage: you get negative data which doesn’t
make sense
- good for detailed inspection of the shape of the data
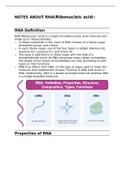
Distribution shapes:
Unimodal distribution:
Bimodal distribution: 2 peaks
one peak
possibly due to 2 groups
Symmetric distribution
Positively skewed distribution
= skewed to the right
= long right tail
Summary statistics
Level: location statistics what are “typical” values?
- Mean: average; sensitive to outliers; misleading
- Mode: most frequent value
- Median: middle value or average of two middle values
!!! Averages do not tell the whole story !!!
Huge difference between mean and median indicate asymmetry in dataset.
Spread/variability: scale statistics how much do values vary?
- Range: minimum – maximum
- Interquartile range: IQR: 3rd quartile – 1st quartile
- Median absolute deviation MAD
- Standard deviation: √ variance ; sensitive to outliers
Standardization:
, Standardization data into z-scores shifts the data by subtracting the mean( x ) and rescales the values
by their standard deviation(sd).
x−x
z-scores: z=
sd
Negative z-score indicates that the value is below the mean.
Z-scores allows to compare values in different units or from different populations.
RULE OF THUMB: observations with a z-score larger than 2.5 are considered to be extreme/outliers
Allowed actions for data types:
OK to compute Nomina Ordinal Interval Ratio
l
Frequency distribution Yes Yes Yes Yes
Median and percentiles No Yes Yes Yes
Add or subtract No No Yes Yes
Mean, sd, se of mean No No Yes Yes
ratio no No No Yes
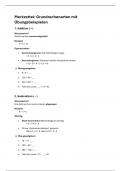
Box-and-whisker-plot: easy way to display summary statistics
Violin plot: combination of box-and-whisker-plot and kernel density plot
- Shows global shape of boxplot
- Local details of kernel density plot
Probability theory:
Probability: a number between 0 and 1 that indicates how likely an event is
Comes with 3 types of distributions:
1. Binomial distribution:
X ~ Bin(n,p)
N = number of observations
P = “success” probability. This success is defined by the user
P(X = k), X ~ Bin(n,p)
Means the probability X equals k, when X follows a binominal distribution
P(X≤k), X ~ Bin(n,p) ; cumulative distribution function
Outcome: discrete distribution
2. Normal/Gaussian/bell curve distribution
X ~ N( μ , σ 2)
μ = mean (location parameter)
2
σ = variance (larger values indicate more spread) does not have a unit!
Standard normal distribution: μ=0 en σ 2=1
Outcome: continuous distribution
3. Cumulative probabilities/counts
Uniquely define a probability distribution.
ECDF: Empirical Cumulative Distribution Function
Week 1: EDA
EDA = Exploratory Data Analysis
Key features:
- Emphasis on getting to know the data
- Generate questions
- Extensive use of graphs
Data analytics life cycle:
Problem statement: problem that you are trying to solve
Organize data in a clear way
Clean: check whether the data is OK, if there are any wrong values, they should be removed
Transform: get specific info out of the dataset such as minimum, maximum and average.
Statistics: can be used to draw conclusions about data data over a larger period of time.
Visualize: useful tool to present insight of data
Mine: offers tools to investigate relationships between variables of datasets.
Communication: get the results of the data across to other people
Descriptive data analytics: insight into the past.
Predictive data analytics: looking into the future.
Prescriptive data analytics: advices on how to influence the future.
Tables:
- Good for reading off values
- Draw attention to actual sizes
2 types of tables:
1. Reference table: all data stored in it, easy to look up data
2. Demonstration table: present just enough data to illustrate a point
Data types:
Categorical:
o Dichotomous: yes/no, male/female
o Nominal: movie genre, no ordering
o Ordinal: ratings; bad/neutral/good
Numerical:
o Interval: no fixed zero point so only difference has a meaning such as temperature, pH-
value
o Ratio: has fixed zero point, budget, weight, length
,Graphs:
Dot plots/strip plots
- showing actual values/structure of numerical variables
- not suitable for large data sets
Histogram
- easily judge distributional properties like (a)symmetry
- distribution of numerical data
- sensitive to bin width
- choosing number of bins: √ n met n het aantal observaties
- no gaps between the bars
Bar chart
- gaps between the bars
- distribution of categorical data
KDP: kernel density plot
- improved histogram
- uses moving bins instead of fixed bins; disadvantage: you get negative data which doesn’t
make sense
- good for detailed inspection of the shape of the data
Distribution shapes:
Unimodal distribution:
Bimodal distribution: 2 peaks
one peak
possibly due to 2 groups
Symmetric distribution
Positively skewed distribution
= skewed to the right
= long right tail
Summary statistics
Level: location statistics what are “typical” values?
- Mean: average; sensitive to outliers; misleading
- Mode: most frequent value
- Median: middle value or average of two middle values
!!! Averages do not tell the whole story !!!
Huge difference between mean and median indicate asymmetry in dataset.
Spread/variability: scale statistics how much do values vary?
- Range: minimum – maximum
- Interquartile range: IQR: 3rd quartile – 1st quartile
- Median absolute deviation MAD
- Standard deviation: √ variance ; sensitive to outliers
Standardization:
, Standardization data into z-scores shifts the data by subtracting the mean( x ) and rescales the values
by their standard deviation(sd).
x−x
z-scores: z=
sd
Negative z-score indicates that the value is below the mean.
Z-scores allows to compare values in different units or from different populations.
RULE OF THUMB: observations with a z-score larger than 2.5 are considered to be extreme/outliers
Allowed actions for data types:
OK to compute Nomina Ordinal Interval Ratio
l
Frequency distribution Yes Yes Yes Yes
Median and percentiles No Yes Yes Yes
Add or subtract No No Yes Yes
Mean, sd, se of mean No No Yes Yes
ratio no No No Yes
Box-and-whisker-plot: easy way to display summary statistics
Violin plot: combination of box-and-whisker-plot and kernel density plot
- Shows global shape of boxplot
- Local details of kernel density plot
Probability theory:
Probability: a number between 0 and 1 that indicates how likely an event is
Comes with 3 types of distributions:
1. Binomial distribution:
X ~ Bin(n,p)
N = number of observations
P = “success” probability. This success is defined by the user
P(X = k), X ~ Bin(n,p)
Means the probability X equals k, when X follows a binominal distribution
P(X≤k), X ~ Bin(n,p) ; cumulative distribution function
Outcome: discrete distribution
2. Normal/Gaussian/bell curve distribution
X ~ N( μ , σ 2)
μ = mean (location parameter)
2
σ = variance (larger values indicate more spread) does not have a unit!
Standard normal distribution: μ=0 en σ 2=1
Outcome: continuous distribution
3. Cumulative probabilities/counts
Uniquely define a probability distribution.
ECDF: Empirical Cumulative Distribution Function