Chapter 2: Descriptive Statistics – Tabular and Graphical Methods
Textbook Exercises
1. The response to a question has three options: A, B, C. A sample of 120 responses provides 60 A, 24
B, 36 C. Construct the frequency and relative frequency distributions.
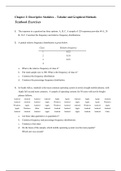
2. A partial relative frequency distribution is given below.
Class Relative frequency
1 0.22
2 0.18
3 0.35
4
a. What is the relative frequency of class 4?
b. The total sample size is 300. What is the frequency of class 4?
c. Construct the frequency distribution.
d. Construct the percentage frequency distribution.
3. In South Africa, Android is the most common operating system in newly-bought mobile phones, with
Apple IoS second most common. A sample of operating systems for 50 users with newly-bought
phones follows.
Android Android Android Android Apple Apple Android Apple Apple Android
Android Android Android Apple Windows Android Apple Apple Apple Windows
Windows Apple Android Apple Windows Android Android Windows Android Apple
Apple Windows Other Android Android Android Apple Android Android Android
Android Android Android Apple Android Android Apple Android Android Other
a. Are these data qualitative or quantitative?
b. Construct frequency and percentage frequency distributions.
c. Construct a bar chart.
d. On the basis of the sample, which mobile operating system was the most popular?
Which one was second?
Textbook Exercises
1. The response to a question has three options: A, B, C. A sample of 120 responses provides 60 A, 24
B, 36 C. Construct the frequency and relative frequency distributions.
2. A partial relative frequency distribution is given below.
Class Relative frequency
1 0.22
2 0.18
3 0.35
4
a. What is the relative frequency of class 4?
b. The total sample size is 300. What is the frequency of class 4?
c. Construct the frequency distribution.
d. Construct the percentage frequency distribution.
3. In South Africa, Android is the most common operating system in newly-bought mobile phones, with
Apple IoS second most common. A sample of operating systems for 50 users with newly-bought
phones follows.
Android Android Android Android Apple Apple Android Apple Apple Android
Android Android Android Apple Windows Android Apple Apple Apple Windows
Windows Apple Android Apple Windows Android Android Windows Android Apple
Apple Windows Other Android Android Android Apple Android Android Android
Android Android Android Apple Android Android Apple Android Android Other
a. Are these data qualitative or quantitative?
b. Construct frequency and percentage frequency distributions.
c. Construct a bar chart.
d. On the basis of the sample, which mobile operating system was the most popular?
Which one was second?