EUP1501
Assignment 4 Semester 2 2025
Unique number:
Due Date: October 2025
SECTION A
COMPLETE ANSWER WITH STEP BY STEP GUIDELINES
Terms of use
By making use of this document you agree to:
Use this document as a guide for learning, comparison and reference purpose,
Terms of use
Not to duplicate, reproduce and/or misrepresent the contents of this document as your own work,
By making use of this document you agree to:
Use this document
Fully accept the consequences
solely as a guide forshould you plagiarise
learning, reference,or and
misuse this document.
comparison purposes,
Ensure originality of your own work, and fully accept the consequences should you plagiarise or misuse this document.
Comply with all relevant standards, guidelines, regulations, and legislation governing academic and written work.
Disclaimer
Great care has been taken in the preparation of this document; however, the contents are provided "as is" without any express or
implied representations or warranties. The author accepts no responsibility or liability for any actions taken based on the
information contained within this document. This document is intended solely for comparison, research, and reference purposes.
Reproduction, resale, or transmission of any part of this document, in any form or by any means, is strictly prohibited.
, +27 67 171 1739
SECTION A
COMPLETE ANSWER WITH STEP BY STEP GUIDELINES
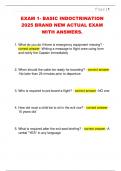
Column1 Column2 Column3 Column4 Column5 Column6 Column7 Column8
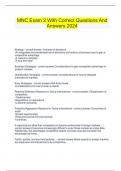
No Drone Model Sales Region Units Sold Unit Price Total Revenue Profit (%) Profit Amount
1 DJI Phantom 4 North America 500 R1 200,00 R600 000,00 25% R150 000,00
2 Parrot Anafi Europe 300 R800,00 R240 000,00 30% R72 000,00
3 DJI Mavic Air 2 Asia 700 R1 000,00 R700 000,00 28% R196 000,00
4 Skydio 2 South America 250 R1 500,00 R375 000,00 32% R120 000,00
5 Autel Evo II Africa 180 R1 100,00 R198 000,00 27% R53 460,00
6 Sum R5 600,00 R2 113 000,00 R591 460,00
7 Average R1 120,00 R422 600,00 R118 292,00
8 Max R1 500,00 R700 000,00 R196 000,00
9 Min R800,00 R198 000,00 R53 460,00
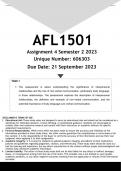
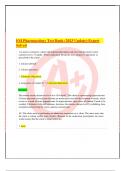
Total Revenue by Sales Region
R800 000,00
R700 000,00
R600 000,00
R500 000,00
R400 000,00
Total Revenue
R300 000,00
R200 000,00
R100 000,00
R0,00
North America Europe Asia South America Africa
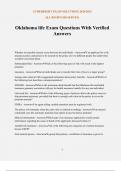
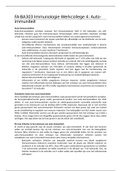
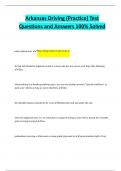
Market share of each drone model
Autel
Evo II
9%
DJI Phantom 4
Skydio 2
26%
20%
Parrot Anafi
12%
DJI Mavic Air 2
33%
Disclaimer
Great care has been taken in the preparation of this document; however, the contents are provided "as is"
without any express or implied representations or warranties. The author accepts no responsibility or
liability for any actions taken based on the information contained within this document. This document is
intended solely for comparison, research, and reference purposes. Reproduction, resale, or transmission
of any part of this document, in any form or by any means, is strictly prohibited.
, +27 67 171 1739
STEP-BY-STEP GUIDELINE INSTRUCTIONS FOR SECTION A
Step 1: Create the Drone Sales Dataset
1. Open Microsoft Excel and create a blank spreadsheet.
2. Enter the column headers exactly as follows:
o Drone Model, Sales Region, Units Sold, Unit Price, Total Revenue,
Profit Margin (%), Profit Amount
3. Input the 5 rows of drone data as provided.
4. Leave rows for Sum, Average, Max, and Min under the dataset.
Step 2: Format Headers [2 marks]
Bold all column headers.
Select the headers:
o Click and drag to highlight all the column headers (e.g. “Drone Model”, “Sales
Region”, “Units Sold”, etc.).
Make the text bold:
o On the Home tab (in the Excel ribbon at the top),
o Click the “B” button in the Font group, or press Ctrl + B on your keyboard.
Change font size of headers to 12pt.
While the headers are still selected, Disclaimer
Great care has been taken in the preparation of this document; however, the contents are provided "as is"
without any express or implied representations or warranties. The author accepts no responsibility or
liability for any actions taken based on the information contained within this document. This document is
intended solely for comparison, research, and reference purposes. Reproduction, resale, or transmission
of any part of this document, in any form or by any means, is strictly prohibited.
Assignment 4 Semester 2 2025
Unique number:
Due Date: October 2025
SECTION A
COMPLETE ANSWER WITH STEP BY STEP GUIDELINES
Terms of use
By making use of this document you agree to:
Use this document as a guide for learning, comparison and reference purpose,
Terms of use
Not to duplicate, reproduce and/or misrepresent the contents of this document as your own work,
By making use of this document you agree to:
Use this document
Fully accept the consequences
solely as a guide forshould you plagiarise
learning, reference,or and
misuse this document.
comparison purposes,
Ensure originality of your own work, and fully accept the consequences should you plagiarise or misuse this document.
Comply with all relevant standards, guidelines, regulations, and legislation governing academic and written work.
Disclaimer
Great care has been taken in the preparation of this document; however, the contents are provided "as is" without any express or
implied representations or warranties. The author accepts no responsibility or liability for any actions taken based on the
information contained within this document. This document is intended solely for comparison, research, and reference purposes.
Reproduction, resale, or transmission of any part of this document, in any form or by any means, is strictly prohibited.
, +27 67 171 1739
SECTION A
COMPLETE ANSWER WITH STEP BY STEP GUIDELINES
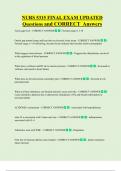
Column1 Column2 Column3 Column4 Column5 Column6 Column7 Column8
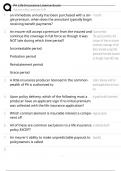
No Drone Model Sales Region Units Sold Unit Price Total Revenue Profit (%) Profit Amount
1 DJI Phantom 4 North America 500 R1 200,00 R600 000,00 25% R150 000,00
2 Parrot Anafi Europe 300 R800,00 R240 000,00 30% R72 000,00
3 DJI Mavic Air 2 Asia 700 R1 000,00 R700 000,00 28% R196 000,00
4 Skydio 2 South America 250 R1 500,00 R375 000,00 32% R120 000,00
5 Autel Evo II Africa 180 R1 100,00 R198 000,00 27% R53 460,00
6 Sum R5 600,00 R2 113 000,00 R591 460,00
7 Average R1 120,00 R422 600,00 R118 292,00
8 Max R1 500,00 R700 000,00 R196 000,00
9 Min R800,00 R198 000,00 R53 460,00
Total Revenue by Sales Region
R800 000,00
R700 000,00
R600 000,00
R500 000,00
R400 000,00
Total Revenue
R300 000,00
R200 000,00
R100 000,00
R0,00
North America Europe Asia South America Africa
Market share of each drone model
Autel
Evo II
9%
DJI Phantom 4
Skydio 2
26%
20%
Parrot Anafi
12%
DJI Mavic Air 2
33%
Disclaimer
Great care has been taken in the preparation of this document; however, the contents are provided "as is"
without any express or implied representations or warranties. The author accepts no responsibility or
liability for any actions taken based on the information contained within this document. This document is
intended solely for comparison, research, and reference purposes. Reproduction, resale, or transmission
of any part of this document, in any form or by any means, is strictly prohibited.
, +27 67 171 1739
STEP-BY-STEP GUIDELINE INSTRUCTIONS FOR SECTION A
Step 1: Create the Drone Sales Dataset
1. Open Microsoft Excel and create a blank spreadsheet.
2. Enter the column headers exactly as follows:
o Drone Model, Sales Region, Units Sold, Unit Price, Total Revenue,
Profit Margin (%), Profit Amount
3. Input the 5 rows of drone data as provided.
4. Leave rows for Sum, Average, Max, and Min under the dataset.
Step 2: Format Headers [2 marks]
Bold all column headers.
Select the headers:
o Click and drag to highlight all the column headers (e.g. “Drone Model”, “Sales
Region”, “Units Sold”, etc.).
Make the text bold:
o On the Home tab (in the Excel ribbon at the top),
o Click the “B” button in the Font group, or press Ctrl + B on your keyboard.
Change font size of headers to 12pt.
While the headers are still selected, Disclaimer
Great care has been taken in the preparation of this document; however, the contents are provided "as is"
without any express or implied representations or warranties. The author accepts no responsibility or
liability for any actions taken based on the information contained within this document. This document is
intended solely for comparison, research, and reference purposes. Reproduction, resale, or transmission
of any part of this document, in any form or by any means, is strictly prohibited.