WTS TUTORING
2022 WTS FUCTIONS & INVERSES
GRADE : 12
COMPILED BY : PROF KHANGELANI SIBIYA
CELL NO. : 082 672 7928
EMAIL :
FACEBOOK P. : WTS MATHS & SCEINCE TUTORING
GROUP WHATSAP : 082 672 7928
INSTAGRAM : WTSTUTOR
TWITER : WTSTUTOR
WEBSITE : www.wtstutor.co.za/www.wtstutoring.org
WHERE TO START MATHS & SCIENCE IS FOR THE NATION
WTS TUTORING 1
,WTS TUTORING 2
,FUNCTIONS AND INVERSES
A relation is just a set of ordered pairs. There is absolutely nothing special at all
about the data that are in a relation.
In other words, any bunch of data is a relation so long as these numbers comes in
pairs.
A set of all the starting point is called “the domain” and a set of all ending points is
called a range. In other words the domain is what you start with, and the range is what
you end with (i.e. x values and y-values respectively).
A function is a relationship between x and y, where for every x-value there is only
one y-value.
One way to decide whether or not a graph represents a function is to use the vertical
line test.
If any line drawn parallel to the y-axis cuts the graph only once, then the graph
represents a function.
We use function notation f(x) to show that each y-value is a function of an x-value.
TYPES OF MAPPINGS
Functions
One to one mapping- x and y values are not repeated.
Many to one mapping- x values are not repeated but y values are repeated.
Non-Functions
One to many mapping- x values repeat y values do not.
Many to many mapping- x and y values repeat.
WTS TUTORING 3
, Key words:
Domain: the set of possible x-values
Range: the set of possible y-values
Axis of symmetry: an imaginary line that divides a graph into two mirror images of
each other.
Maximum: the highest possible y-value of a function.
Minimum: the lowest possible y-value of a function.
Asymptote: an imaginary line that a graph approaches but never touches.
Turning point: The point at which a graph reaches its maximum or minimum value
and changes direction.
Increasing- as x increases the y values increase.( positive gradient)
Decreasing- as x increases the y values decrease. (negative gradient)
Key notes:
[ kwv right-hand rule : both x and y increases]
[ kwv left-hand rule : as x increases ,y decreases]
[horizontal line]
[vertical line]
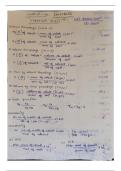
[ average gradient]
[ parallel lines]
[ perpendicular lines]
[ value included]
[ value excluded]
The point is given by:
WTS TUTORING 4
2022 WTS FUCTIONS & INVERSES
GRADE : 12
COMPILED BY : PROF KHANGELANI SIBIYA
CELL NO. : 082 672 7928
EMAIL :
FACEBOOK P. : WTS MATHS & SCEINCE TUTORING
GROUP WHATSAP : 082 672 7928
INSTAGRAM : WTSTUTOR
TWITER : WTSTUTOR
WEBSITE : www.wtstutor.co.za/www.wtstutoring.org
WHERE TO START MATHS & SCIENCE IS FOR THE NATION
WTS TUTORING 1
,WTS TUTORING 2
,FUNCTIONS AND INVERSES
A relation is just a set of ordered pairs. There is absolutely nothing special at all
about the data that are in a relation.
In other words, any bunch of data is a relation so long as these numbers comes in
pairs.
A set of all the starting point is called “the domain” and a set of all ending points is
called a range. In other words the domain is what you start with, and the range is what
you end with (i.e. x values and y-values respectively).
A function is a relationship between x and y, where for every x-value there is only
one y-value.
One way to decide whether or not a graph represents a function is to use the vertical
line test.
If any line drawn parallel to the y-axis cuts the graph only once, then the graph
represents a function.
We use function notation f(x) to show that each y-value is a function of an x-value.
TYPES OF MAPPINGS
Functions
One to one mapping- x and y values are not repeated.
Many to one mapping- x values are not repeated but y values are repeated.
Non-Functions
One to many mapping- x values repeat y values do not.
Many to many mapping- x and y values repeat.
WTS TUTORING 3
, Key words:
Domain: the set of possible x-values
Range: the set of possible y-values
Axis of symmetry: an imaginary line that divides a graph into two mirror images of
each other.
Maximum: the highest possible y-value of a function.
Minimum: the lowest possible y-value of a function.
Asymptote: an imaginary line that a graph approaches but never touches.
Turning point: The point at which a graph reaches its maximum or minimum value
and changes direction.
Increasing- as x increases the y values increase.( positive gradient)
Decreasing- as x increases the y values decrease. (negative gradient)
Key notes:
[ kwv right-hand rule : both x and y increases]
[ kwv left-hand rule : as x increases ,y decreases]
[horizontal line]
[vertical line]
[ average gradient]
[ parallel lines]
[ perpendicular lines]
[ value included]
[ value excluded]
The point is given by:
WTS TUTORING 4