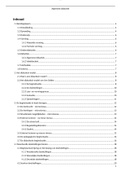
Meetniveau’s
Meetniveau Aspecten
Nominaal - Waarden zijn nummers die een
categorie representeren
- Alleen berekeningen op basis van
frequenties of percentages zijn
mogelijk
Ordinaal - Waarden moeten de gerangschikte
volgorde voorstellen
- Data kan behandeld worden als
nominaal, maar niet als interval
Interval - Waarden zijn echte getallen
- Data kan worden behandeld als
nominaal of ordinaal
Ratio - Waarden zijn echte getallen
- Alle berekeningen zijn mogelijk
- Data kan worden behandeld als
nominaal, ordinaal of interval
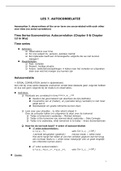
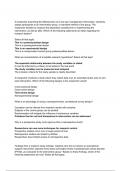
Statistical techniques for nominal data
Problem objective Number of categories Statistical technique
Describe a population 2 z-test of p (12.3)* or
𝜒2 goodness-of-fit test (15.1)
More than 2 𝜒2 goodness-of-fit test (15.1)
Compare two populations 2 z-test of p1 – p2 (13.5)*
𝜒2 test of a contingency table (15.2)
More than 2 𝜒2 test of a contingency table (15.2)
Compare two or more populations 2 or more 𝜒2 test of a contingency table (15.2)
Analyze the relationship between two variables 2 or more 𝜒2 test of a contingency table (15.2)
* suited for one-tailed testing
H15, p595
1
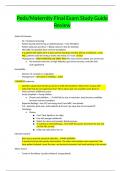
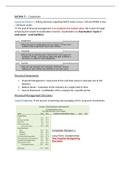
,Experiment
Independent samples Dependent samples
Different data sources Same data source:
- Unrelated - Paired or matched
- Independent - Repeated measures (before/after)
Use the difference between the 2 sample means: x́ 1−x́ 2 Use the difference between each pair of observations: d i=x 1 i−x 2 i
Independent samples t-test Paired samples t-test
Example: compare the mean income for two socioeconomic groups Example: compare the daily sales for two restaurants
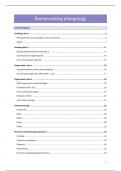
Test procedures
Type of data
Objective Nominal Ordinal Interval/ratio
Determine central tendency Mode Median Mean
Test the population mean z-test for p t-test
Test the distribution of a variable Chi-squared goodness-of-fit
Compare two independent samples Chi-squared test of independence - Wilcoxon rank sum test T2 – test
- Mann-whitney test
Compare more than two Chi-squared test of independence Kruskal-Wallis test ANOVA
independent samples
Compare related samples - Sign test - TD -test
- Friedman test - Wilcoxon signed rank sum
test
Determine association between two Chi-squared test of independence Spearman rank correlation Pearson correlation coefficient
variables coefficient
Explaining a variable Regression analysis
2
, Hoofdstuk 3: graphical descriptive
Formule Betekenis Verwijzing (pagina)
largest observation−smallest observation The number of class intervals H3: p49
Class width=
number of classes
Hoofdstuk 4: Numerical descriptive techniques
Paragraaf 4.2: measures of variability
Omschrijving formule Formule Uitleg Verwijzing
Range Range=largest observation−smallest observation Difference between smallest and H4: p108
highest observation
Population variance :σ 2 N
H4: p108
∑ ¿¿ ¿
i=1
2 N
Sample variance : s H4: p108
∑ ¿¿ ¿
i=1
Sample variance shortcut :s 2
1 H4: p111
s2= ¿
n−1
Population standard deviation σ =√ σ 2 H4: p155
Sample standard deviation s= √ s2 H4: p155
Paragraaf 4.3: relative standing and box plots
Omschrijving formule Formule Uitleg Verwijzing
Kwartiel ( n+1 )∗P Plek waar de kwartielen zitten. H4: p118!!!
L p= P: 25%, 50% (median), 75%.
100
Interquartile range ¿ Q 3−Q 1 Spread between 50% of observations H4: p120
3
, Paragraaf 4.4: measures of lineear relationship:
Omschrijving formule Formule Uitleg Verwijzing
n
Population covariance Kan je alleen aan zien of positieve of H4: p127
∑ (x i−μ x )( y i−μ y ) negatieve linear relatie is. Sterkte is
σ xy = i=1 onbekend
N
Sample covariance shortcut n
x y Kan je alleen aan zien of positieve of H4: p134
s xy =
1
n−1 ( ∑ x i y i− ∑ in∑ i ) negatieve linear relatie is. Sterkte is
i=1
onbekend
Variance of X 2 H4: p134
n
(∑ xi )
2
s=
x
1
n−1 (∑i=1
2
x−
i
n )2
Variance of Y H4: p134
n
(∑ y i
2
s=
y
1
n−1 i=1(∑ y 2i −
n
)
)
Population coefficient of correlation σ Moet tussen -1 en +1 zijn H4: p128
ρ= xy Sterkte van lineaire relatie.
σx σ y
Sample coefficient of correlation s xy Moet tussen -1 en +1 zijn H4: p127
r= Sterkte van lineaire relationship.
sx s y
s x en s2y nog∈wortel doen!
2
Coefficient of determination R2=r 2 This tells us that ..% of the variation is H4: p139
s2 SSE explained by the number of … The
R2= 2 xy2 =1− remaining ..% is unexplained.
sx sy ∑ ¿¿¿
Least squares method ^y =b0 +b1 x H4: p135
Slopecoefficient s Heeft een betekenis H4: p135
b 1= xy2
sx
y−intercept b 0= ý−b1 x́ Heeft geen betekenis H4: p135
Gemiddelde Y
ý=
∑ yi H4: p135
n
4
Meetniveau Aspecten
Nominaal - Waarden zijn nummers die een
categorie representeren
- Alleen berekeningen op basis van
frequenties of percentages zijn
mogelijk
Ordinaal - Waarden moeten de gerangschikte
volgorde voorstellen
- Data kan behandeld worden als
nominaal, maar niet als interval
Interval - Waarden zijn echte getallen
- Data kan worden behandeld als
nominaal of ordinaal
Ratio - Waarden zijn echte getallen
- Alle berekeningen zijn mogelijk
- Data kan worden behandeld als
nominaal, ordinaal of interval
Statistical techniques for nominal data
Problem objective Number of categories Statistical technique
Describe a population 2 z-test of p (12.3)* or
𝜒2 goodness-of-fit test (15.1)
More than 2 𝜒2 goodness-of-fit test (15.1)
Compare two populations 2 z-test of p1 – p2 (13.5)*
𝜒2 test of a contingency table (15.2)
More than 2 𝜒2 test of a contingency table (15.2)
Compare two or more populations 2 or more 𝜒2 test of a contingency table (15.2)
Analyze the relationship between two variables 2 or more 𝜒2 test of a contingency table (15.2)
* suited for one-tailed testing
H15, p595
1
,Experiment
Independent samples Dependent samples
Different data sources Same data source:
- Unrelated - Paired or matched
- Independent - Repeated measures (before/after)
Use the difference between the 2 sample means: x́ 1−x́ 2 Use the difference between each pair of observations: d i=x 1 i−x 2 i
Independent samples t-test Paired samples t-test
Example: compare the mean income for two socioeconomic groups Example: compare the daily sales for two restaurants
Test procedures
Type of data
Objective Nominal Ordinal Interval/ratio
Determine central tendency Mode Median Mean
Test the population mean z-test for p t-test
Test the distribution of a variable Chi-squared goodness-of-fit
Compare two independent samples Chi-squared test of independence - Wilcoxon rank sum test T2 – test
- Mann-whitney test
Compare more than two Chi-squared test of independence Kruskal-Wallis test ANOVA
independent samples
Compare related samples - Sign test - TD -test
- Friedman test - Wilcoxon signed rank sum
test
Determine association between two Chi-squared test of independence Spearman rank correlation Pearson correlation coefficient
variables coefficient
Explaining a variable Regression analysis
2
, Hoofdstuk 3: graphical descriptive
Formule Betekenis Verwijzing (pagina)
largest observation−smallest observation The number of class intervals H3: p49
Class width=
number of classes
Hoofdstuk 4: Numerical descriptive techniques
Paragraaf 4.2: measures of variability
Omschrijving formule Formule Uitleg Verwijzing
Range Range=largest observation−smallest observation Difference between smallest and H4: p108
highest observation
Population variance :σ 2 N
H4: p108
∑ ¿¿ ¿
i=1
2 N
Sample variance : s H4: p108
∑ ¿¿ ¿
i=1
Sample variance shortcut :s 2
1 H4: p111
s2= ¿
n−1
Population standard deviation σ =√ σ 2 H4: p155
Sample standard deviation s= √ s2 H4: p155
Paragraaf 4.3: relative standing and box plots
Omschrijving formule Formule Uitleg Verwijzing
Kwartiel ( n+1 )∗P Plek waar de kwartielen zitten. H4: p118!!!
L p= P: 25%, 50% (median), 75%.
100
Interquartile range ¿ Q 3−Q 1 Spread between 50% of observations H4: p120
3
, Paragraaf 4.4: measures of lineear relationship:
Omschrijving formule Formule Uitleg Verwijzing
n
Population covariance Kan je alleen aan zien of positieve of H4: p127
∑ (x i−μ x )( y i−μ y ) negatieve linear relatie is. Sterkte is
σ xy = i=1 onbekend
N
Sample covariance shortcut n
x y Kan je alleen aan zien of positieve of H4: p134
s xy =
1
n−1 ( ∑ x i y i− ∑ in∑ i ) negatieve linear relatie is. Sterkte is
i=1
onbekend
Variance of X 2 H4: p134
n
(∑ xi )
2
s=
x
1
n−1 (∑i=1
2
x−
i
n )2
Variance of Y H4: p134
n
(∑ y i
2
s=
y
1
n−1 i=1(∑ y 2i −
n
)
)
Population coefficient of correlation σ Moet tussen -1 en +1 zijn H4: p128
ρ= xy Sterkte van lineaire relatie.
σx σ y
Sample coefficient of correlation s xy Moet tussen -1 en +1 zijn H4: p127
r= Sterkte van lineaire relationship.
sx s y
s x en s2y nog∈wortel doen!
2
Coefficient of determination R2=r 2 This tells us that ..% of the variation is H4: p139
s2 SSE explained by the number of … The
R2= 2 xy2 =1− remaining ..% is unexplained.
sx sy ∑ ¿¿¿
Least squares method ^y =b0 +b1 x H4: p135
Slopecoefficient s Heeft een betekenis H4: p135
b 1= xy2
sx
y−intercept b 0= ý−b1 x́ Heeft geen betekenis H4: p135
Gemiddelde Y
ý=
∑ yi H4: p135
n
4