DISPLAYING DATA IN TABLES AND
GRAPHS
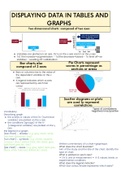
Two dimensional charts: composed of two axes
Variables are plotted on an axis. DV is on the x axis and IV on the y axis
To/ the increase=augmentation - To/the decrease=baisse - To level off=se
stabiliser - Levelling off=satbilisation
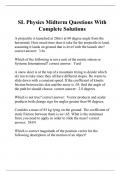
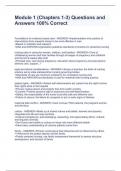
Bar charts also Pie Charts represent
composed of 2 axes scores in percentage as
sections or areas
Bars or columns rise to the value of
the dependent variable on the x
axis.
A legend indicates which scores
are represented by each bar
colour
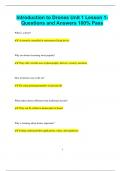
Scatter diagrams or plots
are used to represent
correlations
Types of correlations:
Vocabulary: negative/none/positive
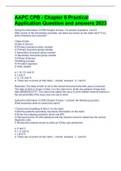
Describing graph
the scores or values of the DV (numerical
variable) are plotted on the x axis.
the conditions (groups) of the IV
(categorical variable) are plotted on the y
axis.
the legend in a graph
[bar chart] …. shades (e.g. grey, black, white,
hatched, dotted etc. bar)
[run chart] …. symbols (e.g. circles, squares,
crosses), lines (dotted, thick, thin, black, grey,
light/dark grey etc. line) Written commentary of a chart=graphique:
[pie chart] …. areas (e.g. grey, light/ dark grey, What does the chart illustrate?
black, white, hatched, dotted etc. area) Aim of the study and the title of the chart. Identify the
type of chart.
What is plotted on each axis?
▪ DV & unit of measurement ▪ IV & values, levels, or
experimental conditions
What does the legend indicate?
Which bar colour/shade represents which data?
GRAPHS
Two dimensional charts: composed of two axes
Variables are plotted on an axis. DV is on the x axis and IV on the y axis
To/ the increase=augmentation - To/the decrease=baisse - To level off=se
stabiliser - Levelling off=satbilisation
Bar charts also Pie Charts represent
composed of 2 axes scores in percentage as
sections or areas
Bars or columns rise to the value of
the dependent variable on the x
axis.
A legend indicates which scores
are represented by each bar
colour
Scatter diagrams or plots
are used to represent
correlations
Types of correlations:
Vocabulary: negative/none/positive
Describing graph
the scores or values of the DV (numerical
variable) are plotted on the x axis.
the conditions (groups) of the IV
(categorical variable) are plotted on the y
axis.
the legend in a graph
[bar chart] …. shades (e.g. grey, black, white,
hatched, dotted etc. bar)
[run chart] …. symbols (e.g. circles, squares,
crosses), lines (dotted, thick, thin, black, grey,
light/dark grey etc. line) Written commentary of a chart=graphique:
[pie chart] …. areas (e.g. grey, light/ dark grey, What does the chart illustrate?
black, white, hatched, dotted etc. area) Aim of the study and the title of the chart. Identify the
type of chart.
What is plotted on each axis?
▪ DV & unit of measurement ▪ IV & values, levels, or
experimental conditions
What does the legend indicate?
Which bar colour/shade represents which data?