Applied Multivariate Data Analysis – Week 1,
Session 2
Ch 9: The Linear Model (Regression)
Introduction to the Linear Model (Regression)
The Linear Model with One Predictor
The fundamental idea is that – an outcome for a person can be predicted from a model and
some error associated with that prediction:
outcome i=( b 0 +b1 X i ) +error i
Y i=( b0 +b 1 X i ) + ε i
This model differs from that of a correlation => only in that it uses an unstandardized
measure of the relationship (b1 => the slope of the line/gradient)
- And includes a parameter (bo => the intercept; constant) => the value of the
outcome when the predictor is 0
The Linear Model with Several Predictors
Y i=( b0 +b 1 X 1 i b2 X 2 i )+ ε i
By estimating the b-values => can make predictions about the outcome based on both of the
predictor variables
Regression analysis – i.e., fitting a linear model to data and using it to predict values of an
outcome variable – from one or more predictor variables
͢ One predictor variable => simple regression
, ͢ Several predictors => multiple regression
Estimating the Model
The model can be described entirely by a constant (bo) and by parameters associated with
each predictor (bs)
The fit of the model can be estimated by looking at the deviations between the model and the
data collected
͢ The differences between the line (i.e., predicted values) and the observed data => the
residuals
If a model is a perfect fit for the data => then for a given value of the predictor(s), the model
will predict the same value of the outcome as was observed
- i.e., no residuals => no differences between the predicted values and observed
data
Computing the total error in a model => square the differences b/n observed values of
outcome and the predicted values from the model
2
total error=(observed i −modeli )
To assess the error in a linear model => use a sum of squared errors
- Referred to as the sum of squared residuals – or residual sum of squares ( SS R
)
The SS R => provides information about how well a linear model fits the data
͢ If SS R are large => model not representative of the data (i.e., lots of error in
prediction)
͢ If SS R are small => the line is representative
The method of ordinary least squares (OLS) => the method used to estimate the b
parameters that define the regression model for which the SSr is the minimum it can be
(given the data)
, Assessing the Goodness of Fit, Sum of Squares, R and R2
The goodness of fit – i.e., how well the model fits the observed data
The ss R => measures how much error there is in the model
- It quantifies the error in prediction
- It does not show whether using the model is better than nothing
So => compare the model against a baseline
- Check whether it improves how well one can predict the outcome
- Compare the ss R of the two models
If the model is good => it should have sig less error than the baseline model
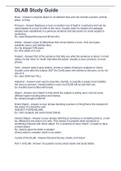
Sum of Squares
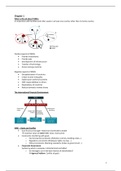
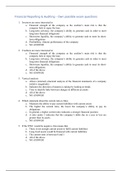
Residual Sum of Squares ( ss R)
Represents the error in prediction (observed data vs
model)
2
ss R=(observed i−model i)
Compare the model vs baseline model
Calculate new model’s ss R
If ss R is less in new model => less error, best
model
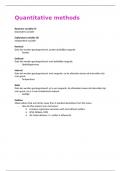
Total Sum of Squares ( ssT )
Represents the sum of squared differences b/n observed
values and values predicted by the mean
2
ssT =(observedi −Y model)
Represents how good the mean is as a model of observed outcome values
Observed data vs. Mean value of Y
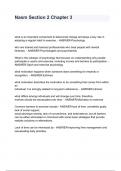
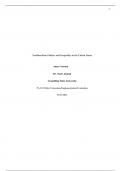
, Model Sum of Squares ( ss M )
Represents the reduction of the inaccuracy of the model – resulting from fitting the regression
model to the data
2
ss M =( Y model i−model i )
¿ ssT −ss R
Improvement in prediction resulting from using the linear model rather than the mean
Large ss M => large improvement in prediction
Small ss M => best model is no better than baseline
Explained Variance ( R2)
2
R => proportion of improvement due to the model
Multiply by 100 => percentage value
Represents the amount of variance in outcome – explained by the model (= SSM) –
relative to the total amount of variation there is to explain (= SS)
2 SS M
R=
SS
√ R2 => the correlation coefficient for the relationship between the values of outcome
predicted by model – and the observed values
Estimate of the overall fit of the regression model
2
R => estimate of the substantive size of model fit
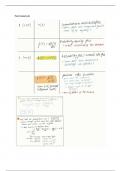
Mean Squares and F-Statistic
F => ratio of improvement due to the model (= SSM) and the error in the model (= SSR)
It is a measure of how much a model has improved the prediction of the outcome –
compared to the level of inaccuracy in that model
systematic variance model
test statistic= =
unsystematic variance error ∈model
The average sums of squares – i.e., the mean squares (MS) – are used to compute F
Session 2
Ch 9: The Linear Model (Regression)
Introduction to the Linear Model (Regression)
The Linear Model with One Predictor
The fundamental idea is that – an outcome for a person can be predicted from a model and
some error associated with that prediction:
outcome i=( b 0 +b1 X i ) +error i
Y i=( b0 +b 1 X i ) + ε i
This model differs from that of a correlation => only in that it uses an unstandardized
measure of the relationship (b1 => the slope of the line/gradient)
- And includes a parameter (bo => the intercept; constant) => the value of the
outcome when the predictor is 0
The Linear Model with Several Predictors
Y i=( b0 +b 1 X 1 i b2 X 2 i )+ ε i
By estimating the b-values => can make predictions about the outcome based on both of the
predictor variables
Regression analysis – i.e., fitting a linear model to data and using it to predict values of an
outcome variable – from one or more predictor variables
͢ One predictor variable => simple regression
, ͢ Several predictors => multiple regression
Estimating the Model
The model can be described entirely by a constant (bo) and by parameters associated with
each predictor (bs)
The fit of the model can be estimated by looking at the deviations between the model and the
data collected
͢ The differences between the line (i.e., predicted values) and the observed data => the
residuals
If a model is a perfect fit for the data => then for a given value of the predictor(s), the model
will predict the same value of the outcome as was observed
- i.e., no residuals => no differences between the predicted values and observed
data
Computing the total error in a model => square the differences b/n observed values of
outcome and the predicted values from the model
2
total error=(observed i −modeli )
To assess the error in a linear model => use a sum of squared errors
- Referred to as the sum of squared residuals – or residual sum of squares ( SS R
)
The SS R => provides information about how well a linear model fits the data
͢ If SS R are large => model not representative of the data (i.e., lots of error in
prediction)
͢ If SS R are small => the line is representative
The method of ordinary least squares (OLS) => the method used to estimate the b
parameters that define the regression model for which the SSr is the minimum it can be
(given the data)
, Assessing the Goodness of Fit, Sum of Squares, R and R2
The goodness of fit – i.e., how well the model fits the observed data
The ss R => measures how much error there is in the model
- It quantifies the error in prediction
- It does not show whether using the model is better than nothing
So => compare the model against a baseline
- Check whether it improves how well one can predict the outcome
- Compare the ss R of the two models
If the model is good => it should have sig less error than the baseline model
Sum of Squares
Residual Sum of Squares ( ss R)
Represents the error in prediction (observed data vs
model)
2
ss R=(observed i−model i)
Compare the model vs baseline model
Calculate new model’s ss R
If ss R is less in new model => less error, best
model
Total Sum of Squares ( ssT )
Represents the sum of squared differences b/n observed
values and values predicted by the mean
2
ssT =(observedi −Y model)
Represents how good the mean is as a model of observed outcome values
Observed data vs. Mean value of Y
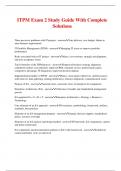
, Model Sum of Squares ( ss M )
Represents the reduction of the inaccuracy of the model – resulting from fitting the regression
model to the data
2
ss M =( Y model i−model i )
¿ ssT −ss R
Improvement in prediction resulting from using the linear model rather than the mean
Large ss M => large improvement in prediction
Small ss M => best model is no better than baseline
Explained Variance ( R2)
2
R => proportion of improvement due to the model
Multiply by 100 => percentage value
Represents the amount of variance in outcome – explained by the model (= SSM) –
relative to the total amount of variation there is to explain (= SS)
2 SS M
R=
SS
√ R2 => the correlation coefficient for the relationship between the values of outcome
predicted by model – and the observed values
Estimate of the overall fit of the regression model
2
R => estimate of the substantive size of model fit
Mean Squares and F-Statistic
F => ratio of improvement due to the model (= SSM) and the error in the model (= SSR)
It is a measure of how much a model has improved the prediction of the outcome –
compared to the level of inaccuracy in that model
systematic variance model
test statistic= =
unsystematic variance error ∈model
The average sums of squares – i.e., the mean squares (MS) – are used to compute F