Seminar Data Analytics
Topic 1 – Unsupervised learning
Data analytics
Data analytics refer to the process of transforming and analysing large datasets to produce
information that can be effectively used. Data analytics are vital to make sense of and use
the information to improve decision-making and business outcomes.
Unsupervised learning (used without having a specific question → e.g. “Do our clients form
natural groups based on similar attributes?”):
- Cluster analysis for identifying groups of observations with a similar profile according to a
specific criteria (big dataset → can groups be created?)
- Principal component analysis (PCA) for summarizing the most important information
contained in a multivariate dataset
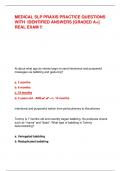
Cluster analysis
Clustering is used to identify groups in a big dataset, where the observations of each group
are very similar to each other. Clustering algorithms calculate the minimum distance of all
observations and group those observations.
Research question = “What are the factors that affect the rejection of a loan?”.
Euclidean distance
The classification of observations into groups requires the computation of the distance/
similarity between each pair of observations → measured by the Euclidean distance:
deuc(x,y) = √ Σ ni=1(x i− y i)2. A smaller Euclidean distance → greater similarity between each
pair of observations.
Cluster methods
Two main categories of clustering:
1. Partitioning methods → observations are assigned to one of K clusters.
K-means clustering is often used in practice because of its simplicity and speed:
- It is considered to be appropriate for large datasets.
- It is less sensitive to outliers.
The goal of clustering is finding groups such that within-group variation is small (i.e.
minimize) (small → good quality of clustering) and the between-group variation is
large (i.e. maximize).
Disadvantage = you have to decide on the amount of clusters yourself.
K-means algorithm:
1. Choose the number of clusters, K.
2. Generate K random points as cluster centre/centroids.
* The algorithm starts by randomly selecting K observations to serve as the
initial centres for the clusters (= cluster means/centroids/centres).
3. Assign each point to the closest cluster centroid (use Euclidean distance)
4. Recompute the new cluster centroid.
* After the assignment step, the algorithm computes the new mean value of
each cluster.
1
, 5. Repeat steps 3 and 4 until some convergence criteria is met.
* Usually the convergence criteria is that the assignment of observations to
clusters has not changed over multiple iterations.
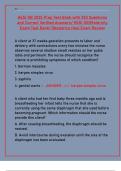
2. Hierarchical methods → seeks to build a hierarchy of clusters without having a fixed
number of clusters. Two types of clustering:
1) Agglomerative clustering: good for identifying small clusters
- Each observation is assigned to a cluster of their own
- Then two nearest clusters are merged into the same cluster until there is only a
single cluster left
2) Divisive clustering: good for identifying large clusters
- The opposite of agglomerative clustering → begins with one cluster
- Then the most heterogeneous (i.e. dissimilar) clusters are successively divided until
all observations have a cluster of their own
The result of hierarchical clustering is a tree-based representation of the clusters,
which is known as dendrogram. The height of the fusion, provided on the vertical
axis, indicates the (dis)similarity between two clusters. The higher the height of the
fusion, the less similar the clusters.
Drawbacks = isn’t appropriate for large datasets, doesn’t work if there are missing
values and doesn’t tell you where to cut the dendrogram.
Basic steps involved in cluster analysis:
1. Formulating the problem → select the variables used as the basis for clustering
2. Deciding on the number of clusters
3. Computing the clusters
4. Plotting the clusters
5. Cluster validation
6. Interpreting clusters, drawing conclusions and use illustrative techniques
R and clustering
Deciding on the number of clusters
Steps:
1. Assess the necessity of forming clusters with the Hopkins statistic H. If H < 0.5 →
clustering is necessary/preferable.
2. Use the elbow method or silhouette method for identifying the number of clusters.
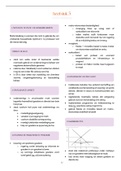
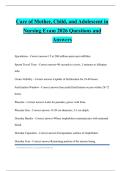
→ Elbow method
Choose a number of clusters so that adding another cluster does not add sufficient
information. This can be determined by plotting the within-group variation against
the number of clusters. At some point, the marginal gain from adding an additional
cluster will drop (the elbow).
→ Silhouette method (measures the quality of clustering)
The silhouette analysis takes both the variation within the clusters (ai) as the
variation between the clusters (bi) into account → Si = (bi – ai)/max(ai, bi):
* Si is close to 1 → good clusters
* Si is close to 0 → bad clusters
2
, Cluster validation
Two commonly used measures for cluster validation (i.e. evaluate the goodness of the
clustering structure):
- Silhouette coefficient (values close to 1 are desirable)
- Dunn index (larger values are desirable)
D = min.separation/max.diameter
* min.separation → minimum inter-cluster distance (should be large)
* max.diameter → maximum intra-cluster distance (should be small)
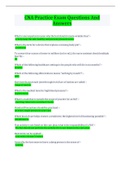
Principal component analysis (PCA)
The goal of PCA is to reduce a large dataset with many variables to a dataset with fewer
variables (i.e. reducing the dimensionality of the data), without losing important
information. Given a set of variables, find a small number of (latent → not directly
observed) variables that describe the original set as good as possible. Moreover, PCA is
useful when independent variables are correlated with each other.
PCA tries to describe the variables in X as good as possible by a few new variables that are a
linear combination of X:
- The new variables are called principal components/dimensions
- The principal components are uncorrelated
- Each principal component/dimension Zs can be expressed as:
Zs = u1X1 + u2X2 + … + upXp
* For the addition to make sense, the variables in X are often standardized (each
variable is equally weighted/important)
* The trick of PCA is to choose Zs such that as much as possible variance of the
variables in X is explained. The amount of variance retained by each principal
component is measured by the eigenvalue → a large eigenvalue (>1) means that the
principal component explains a large amount of the variance.
The PCA method is useful when the variables within the dataset are highly correlated (=
indicates redundancy). Due to this redundancy, PCA can be used to reduce the original
variables into a smaller number of new variables explaining most of the variance in the
original variables.
Research question = “What are the main determinants of the financial performance and
health of Scandinavian companies?”.
Taken together, the main purpose of PCA is to:
- Identify hidden patterns in a dataset
- Reduce the dimensionality of the data by removing noise and redundancy in the data
- Identify correlated variables
Basic steps involved in PCA:
1. Formulate the problem
2. PCA on the dataset
3. Retain principal components
4. Retain variables
3
Topic 1 – Unsupervised learning
Data analytics
Data analytics refer to the process of transforming and analysing large datasets to produce
information that can be effectively used. Data analytics are vital to make sense of and use
the information to improve decision-making and business outcomes.
Unsupervised learning (used without having a specific question → e.g. “Do our clients form
natural groups based on similar attributes?”):
- Cluster analysis for identifying groups of observations with a similar profile according to a
specific criteria (big dataset → can groups be created?)
- Principal component analysis (PCA) for summarizing the most important information
contained in a multivariate dataset
Cluster analysis
Clustering is used to identify groups in a big dataset, where the observations of each group
are very similar to each other. Clustering algorithms calculate the minimum distance of all
observations and group those observations.
Research question = “What are the factors that affect the rejection of a loan?”.
Euclidean distance
The classification of observations into groups requires the computation of the distance/
similarity between each pair of observations → measured by the Euclidean distance:
deuc(x,y) = √ Σ ni=1(x i− y i)2. A smaller Euclidean distance → greater similarity between each
pair of observations.
Cluster methods
Two main categories of clustering:
1. Partitioning methods → observations are assigned to one of K clusters.
K-means clustering is often used in practice because of its simplicity and speed:
- It is considered to be appropriate for large datasets.
- It is less sensitive to outliers.
The goal of clustering is finding groups such that within-group variation is small (i.e.
minimize) (small → good quality of clustering) and the between-group variation is
large (i.e. maximize).
Disadvantage = you have to decide on the amount of clusters yourself.
K-means algorithm:
1. Choose the number of clusters, K.
2. Generate K random points as cluster centre/centroids.
* The algorithm starts by randomly selecting K observations to serve as the
initial centres for the clusters (= cluster means/centroids/centres).
3. Assign each point to the closest cluster centroid (use Euclidean distance)
4. Recompute the new cluster centroid.
* After the assignment step, the algorithm computes the new mean value of
each cluster.
1
, 5. Repeat steps 3 and 4 until some convergence criteria is met.
* Usually the convergence criteria is that the assignment of observations to
clusters has not changed over multiple iterations.
2. Hierarchical methods → seeks to build a hierarchy of clusters without having a fixed
number of clusters. Two types of clustering:
1) Agglomerative clustering: good for identifying small clusters
- Each observation is assigned to a cluster of their own
- Then two nearest clusters are merged into the same cluster until there is only a
single cluster left
2) Divisive clustering: good for identifying large clusters
- The opposite of agglomerative clustering → begins with one cluster
- Then the most heterogeneous (i.e. dissimilar) clusters are successively divided until
all observations have a cluster of their own
The result of hierarchical clustering is a tree-based representation of the clusters,
which is known as dendrogram. The height of the fusion, provided on the vertical
axis, indicates the (dis)similarity between two clusters. The higher the height of the
fusion, the less similar the clusters.
Drawbacks = isn’t appropriate for large datasets, doesn’t work if there are missing
values and doesn’t tell you where to cut the dendrogram.
Basic steps involved in cluster analysis:
1. Formulating the problem → select the variables used as the basis for clustering
2. Deciding on the number of clusters
3. Computing the clusters
4. Plotting the clusters
5. Cluster validation
6. Interpreting clusters, drawing conclusions and use illustrative techniques
R and clustering
Deciding on the number of clusters
Steps:
1. Assess the necessity of forming clusters with the Hopkins statistic H. If H < 0.5 →
clustering is necessary/preferable.
2. Use the elbow method or silhouette method for identifying the number of clusters.
→ Elbow method
Choose a number of clusters so that adding another cluster does not add sufficient
information. This can be determined by plotting the within-group variation against
the number of clusters. At some point, the marginal gain from adding an additional
cluster will drop (the elbow).
→ Silhouette method (measures the quality of clustering)
The silhouette analysis takes both the variation within the clusters (ai) as the
variation between the clusters (bi) into account → Si = (bi – ai)/max(ai, bi):
* Si is close to 1 → good clusters
* Si is close to 0 → bad clusters
2
, Cluster validation
Two commonly used measures for cluster validation (i.e. evaluate the goodness of the
clustering structure):
- Silhouette coefficient (values close to 1 are desirable)
- Dunn index (larger values are desirable)
D = min.separation/max.diameter
* min.separation → minimum inter-cluster distance (should be large)
* max.diameter → maximum intra-cluster distance (should be small)
Principal component analysis (PCA)
The goal of PCA is to reduce a large dataset with many variables to a dataset with fewer
variables (i.e. reducing the dimensionality of the data), without losing important
information. Given a set of variables, find a small number of (latent → not directly
observed) variables that describe the original set as good as possible. Moreover, PCA is
useful when independent variables are correlated with each other.
PCA tries to describe the variables in X as good as possible by a few new variables that are a
linear combination of X:
- The new variables are called principal components/dimensions
- The principal components are uncorrelated
- Each principal component/dimension Zs can be expressed as:
Zs = u1X1 + u2X2 + … + upXp
* For the addition to make sense, the variables in X are often standardized (each
variable is equally weighted/important)
* The trick of PCA is to choose Zs such that as much as possible variance of the
variables in X is explained. The amount of variance retained by each principal
component is measured by the eigenvalue → a large eigenvalue (>1) means that the
principal component explains a large amount of the variance.
The PCA method is useful when the variables within the dataset are highly correlated (=
indicates redundancy). Due to this redundancy, PCA can be used to reduce the original
variables into a smaller number of new variables explaining most of the variance in the
original variables.
Research question = “What are the main determinants of the financial performance and
health of Scandinavian companies?”.
Taken together, the main purpose of PCA is to:
- Identify hidden patterns in a dataset
- Reduce the dimensionality of the data by removing noise and redundancy in the data
- Identify correlated variables
Basic steps involved in PCA:
1. Formulate the problem
2. PCA on the dataset
3. Retain principal components
4. Retain variables
3