Chapter 1
Data Analytics is the process of transforming and evaluating data with the purpose
of drawing conclusions to address business questions.
Effective Data Analytics provides a way to search through large structured and
unstructured data to identify unknown patterns or relationships.
Big Data refers to datasets which are too large and complex to be analyzed
traditionally.
Remember the 4V ’s:
Volume refers to size of dataset
Velocity refers to speed of processing
Variety refers to different types of data
Veracity refers to the data quality.
Goal is to transform (big) data into valuable knowledge to make more informed
business decisions
How does data analytics affect…
auditing?
Data analytics enhances audit quality.
The audit process is changing from a traditional process toward a more
automated one.
Data analytics enables enhanced audits, expanded services, and added value
to clients.
management accounting?
Data analytics enhances cost analysis.
Data analytics enables better decision-making.
Data analytics enables better forecasting, budgeting, production, and sales.
financial reporting?
Accountants make better estimates of collectability, write-downs, etc.
Managers better understand the business environment through social media
and other external data sources.
Analysts identify risks and opportunities through analysis of Internet searches.
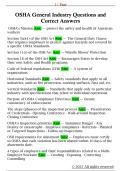
The IMPACT model
Identify the questions.
Master the data.
Perform the test plan.
Address and refine results.
Communicate insights.
Track outcomes.
1
,1) Step 1: Identify the Questions: Understand the business problems that
need to be addressed
Attributes to consider:
What data do we need to answer the question?
Who is the audience that will use the results?
Is the scope of the question too narrow or too broad?
How will the results be used?
2) Step 2: Master the Data
Consider the following 8 elements:
Know what data are available and how they relate to the problem
Data available in Internal systems.
Data available in External networks and data warehouses.
Data dictionaries.
ETL - Extraction, transformation, and loading.
Data validation and completeness.
Data normalization.
Data preparation and scrubbing
3) Step 3: Perform the Test Plan
Identify a relationship between the response (or dependent) variable and those
items that affect the response (also called the predictor, explanatory, or
independent variables).
Generally, we make a model, or a simplified representation of reality, to address
this purpose.
Provost and Fawcett, in their work Data Science for Business, identify 8 key
approaches to Data Analytics depending on the question:
Classification - Assign each unit in a population to a specific (pre-defined)
category or class.
Regression - Predict a continiuous dependent variable’s value based on
independent variable inputs using a statistical model.
Similarity Matching – Identify similar individuals or items based on known
data (e.g., address data: "123 Main St." vs. "123 Main Street")
Clustering - Divide individuals or items into meaningful or useful groups
(without predefined categories).
Co-occurrence Grouping - Discover associations or relationships between
individuals or items based on shared transactions.
Link Prediction - Predict connections or relationships between two data
items.
Profiling - Characterize the typical behavior of an individual, group, or
population by generating summary statistics about the data.
Data Reduction - Reduce the amount of information being analyzed to
focus on the most critical and relevant elements.
2
, 4) Step 4: Address and Refine Results
Identify issues with the analyses, possible issues, and refine the model
Ask further questions.
Explore the data.
Rerun analyses.
5) Step 5 and Step 6: Communicate Insights & Track Outcomes
Communicate effectively using Follow up on the results of the
clear language and visualizations: analysis.
Dashboards. How frequently should the
Static reports. analysis be performed?
Summaries. Have the analytics changed?
What are the trends?
Hands-on example: LendingClub: zie PPT
Chapter 2.1.: Mastering data
Data can be found throughout various
systems.
Internal vs External
Flat files vs Relational Databases
(RDBMS)
In most cases, you need to know which tables and attributes contain the
relevant data.
Unified Modeling Language (UML) is a visual one way to understand databases.
3
Data Analytics is the process of transforming and evaluating data with the purpose
of drawing conclusions to address business questions.
Effective Data Analytics provides a way to search through large structured and
unstructured data to identify unknown patterns or relationships.
Big Data refers to datasets which are too large and complex to be analyzed
traditionally.
Remember the 4V ’s:
Volume refers to size of dataset
Velocity refers to speed of processing
Variety refers to different types of data
Veracity refers to the data quality.
Goal is to transform (big) data into valuable knowledge to make more informed
business decisions
How does data analytics affect…
auditing?
Data analytics enhances audit quality.
The audit process is changing from a traditional process toward a more
automated one.
Data analytics enables enhanced audits, expanded services, and added value
to clients.
management accounting?
Data analytics enhances cost analysis.
Data analytics enables better decision-making.
Data analytics enables better forecasting, budgeting, production, and sales.
financial reporting?
Accountants make better estimates of collectability, write-downs, etc.
Managers better understand the business environment through social media
and other external data sources.
Analysts identify risks and opportunities through analysis of Internet searches.
The IMPACT model
Identify the questions.
Master the data.
Perform the test plan.
Address and refine results.
Communicate insights.
Track outcomes.
1
,1) Step 1: Identify the Questions: Understand the business problems that
need to be addressed
Attributes to consider:
What data do we need to answer the question?
Who is the audience that will use the results?
Is the scope of the question too narrow or too broad?
How will the results be used?
2) Step 2: Master the Data
Consider the following 8 elements:
Know what data are available and how they relate to the problem
Data available in Internal systems.
Data available in External networks and data warehouses.
Data dictionaries.
ETL - Extraction, transformation, and loading.
Data validation and completeness.
Data normalization.
Data preparation and scrubbing
3) Step 3: Perform the Test Plan
Identify a relationship between the response (or dependent) variable and those
items that affect the response (also called the predictor, explanatory, or
independent variables).
Generally, we make a model, or a simplified representation of reality, to address
this purpose.
Provost and Fawcett, in their work Data Science for Business, identify 8 key
approaches to Data Analytics depending on the question:
Classification - Assign each unit in a population to a specific (pre-defined)
category or class.
Regression - Predict a continiuous dependent variable’s value based on
independent variable inputs using a statistical model.
Similarity Matching – Identify similar individuals or items based on known
data (e.g., address data: "123 Main St." vs. "123 Main Street")
Clustering - Divide individuals or items into meaningful or useful groups
(without predefined categories).
Co-occurrence Grouping - Discover associations or relationships between
individuals or items based on shared transactions.
Link Prediction - Predict connections or relationships between two data
items.
Profiling - Characterize the typical behavior of an individual, group, or
population by generating summary statistics about the data.
Data Reduction - Reduce the amount of information being analyzed to
focus on the most critical and relevant elements.
2
, 4) Step 4: Address and Refine Results
Identify issues with the analyses, possible issues, and refine the model
Ask further questions.
Explore the data.
Rerun analyses.
5) Step 5 and Step 6: Communicate Insights & Track Outcomes
Communicate effectively using Follow up on the results of the
clear language and visualizations: analysis.
Dashboards. How frequently should the
Static reports. analysis be performed?
Summaries. Have the analytics changed?
What are the trends?
Hands-on example: LendingClub: zie PPT
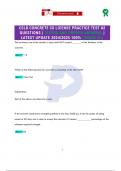
Chapter 2.1.: Mastering data
Data can be found throughout various
systems.
Internal vs External
Flat files vs Relational Databases
(RDBMS)
In most cases, you need to know which tables and attributes contain the
relevant data.
Unified Modeling Language (UML) is a visual one way to understand databases.
3