e-07 = 7 0’s before the output number | SE decreases when sample size increases | 68 – 95 – 99.7 |
USE 3 or ALL DECIMALS WHEN CALCULATING
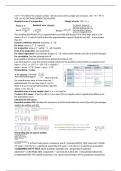
Standard error of a proportion Margin of error 1.96 * π
The sampling distribution of p is approximately normally distributed if N is fairly large and π is not
close to 0 or 1. A rule of thumb is that the approximation is good if both Nπ and N(1 - π) are greater
than 10.
General confidence interval: estimate ± 2 * SE
For mean: mean ± 2 * (s / sqrt(n))
For proportion: prop ± 2 * sqrt(p * (1 - p)) /(sqrt(n))
From R for proportion: Use prop.test()
For slope (regression): Use estimate (slope) ± 2 * SE, where both estimate and SE come from Routput
For correlation: Use the estimate from R
prop.test([# of positives], [n]) OR binom.test([# of positives], [n])
Lazy formulas for C.I (for the mean!) (change values for the question and put them on separate row)
mean = 5.02 | s = 1.87 | n = 300 | SE = s/sqrt(n) |
upper = mean + 2*SE| lower = mean - 2*SE
Standardizing / t value
How many SD
the sample mean away is from mean mu |
table(dataset) # to see how many 1’s or 0’s
Write in R as (x-mu)/(sd/sqrt(n)) (first make the
values x, mu, sd & n)
Standard error of a one sample t-test : S.e. = s.d./sqrt(n)
P value in R (t value) : 2*pt(-[t], [df]) | If you reject H0, my sample mean is significantly different for
the population mean.
Calculate the Chi square
Expected numbers Chi Calculate the outcomes of all the total tables for each of the cells (percentages
need to be written as 0.54)
Interpreting the chi square statistic
# to find P-value given a chisquare and df | pchisq(3.84[chi], 4[df], lower.tail = FALSE)
# P-value < 0.05 there is a significant association # P-value > 0.05 there is no significant association
# GOODNESS OF FIT TEST: Open question (sample size | proportion fractions)
observed <- c(30,98,80,100) | expected <- c(0.10,0.25,0.30,0.35) | chisq.test(x=observed,
p=expected) #H0: The sample proportions are a good representation of the population proportions
USE 3 or ALL DECIMALS WHEN CALCULATING
Standard error of a proportion Margin of error 1.96 * π
The sampling distribution of p is approximately normally distributed if N is fairly large and π is not
close to 0 or 1. A rule of thumb is that the approximation is good if both Nπ and N(1 - π) are greater
than 10.
General confidence interval: estimate ± 2 * SE
For mean: mean ± 2 * (s / sqrt(n))
For proportion: prop ± 2 * sqrt(p * (1 - p)) /(sqrt(n))
From R for proportion: Use prop.test()
For slope (regression): Use estimate (slope) ± 2 * SE, where both estimate and SE come from Routput
For correlation: Use the estimate from R
prop.test([# of positives], [n]) OR binom.test([# of positives], [n])
Lazy formulas for C.I (for the mean!) (change values for the question and put them on separate row)
mean = 5.02 | s = 1.87 | n = 300 | SE = s/sqrt(n) |
upper = mean + 2*SE| lower = mean - 2*SE
Standardizing / t value
How many SD
the sample mean away is from mean mu |
table(dataset) # to see how many 1’s or 0’s
Write in R as (x-mu)/(sd/sqrt(n)) (first make the
values x, mu, sd & n)
Standard error of a one sample t-test : S.e. = s.d./sqrt(n)
P value in R (t value) : 2*pt(-[t], [df]) | If you reject H0, my sample mean is significantly different for
the population mean.
Calculate the Chi square
Expected numbers Chi Calculate the outcomes of all the total tables for each of the cells (percentages
need to be written as 0.54)
Interpreting the chi square statistic
# to find P-value given a chisquare and df | pchisq(3.84[chi], 4[df], lower.tail = FALSE)
# P-value < 0.05 there is a significant association # P-value > 0.05 there is no significant association
# GOODNESS OF FIT TEST: Open question (sample size | proportion fractions)
observed <- c(30,98,80,100) | expected <- c(0.10,0.25,0.30,0.35) | chisq.test(x=observed,
p=expected) #H0: The sample proportions are a good representation of the population proportions