Strategic Position
UNIT 7
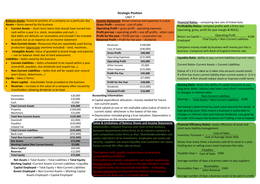
Balance sheets: Financial position of a company on a particular day Income Statement: Shows revenue and expenses in a year. Financial Ratios – comparing two sets of linked data
Assets – items owned by the business Gross Profit = revenue - cost of sales Profitability Ratios- compare profits with a firms size
Current Assets – short-term items that should have turned into Operating Profit = gross profit - operating expenses (operating, gross, profit for year margin & ROCE).
cash within a year (i.e. stock, receivables and cash…) Profit pre-tax = operating profit + one off profits - other costs
Bad debts are defaults on receivables and shouldn’t be included Profit for the year = Profit pre-tax – corporation tax Return on Capital = Operating Profit X100
as assets but as an expense on an income statement Retained Profit = Profit for the year – dividends Employed Total Equity + Non-Current Liabilities
Non-Current Assets –Resources that are repeatedly used during Revenues £100,000
production (depreciate overtime included) – land, machines… Compares money made by business with money put into a
Cost of Sales (£40,000)
Intangible Assets: Value of goodwill (a brand image and patents) Gross Profit £60,000
business. Compared with Bank of England interest rate.
– not on balance sheet due to hard assessment.
Operating Expenses (£15,000) Liquidity Ratio- ability to pay current liabilities (current ratio)
Liabilities – debts owed by the business
Operating Profit £45,000
Current Liabilities – debts scheduled to be repaid within a year
Other Income £5,000 Current Ratio= Current Assets ÷ Current Liabilities
(overdraft, payables, due dividends and unpaid tax…)
Other Expenses (£15,000)
Non-Current Liabilities – debts that will be repaid over several (Value of 1.5-2 is ideal as it takes into account unsold stock)
years (loans, debentures…) Profit Pre-Tax £35,000
If a firm has more current liability than current assets (< 1) it is
Equity – takes 2 forms: Tax (£7,000) insolvent. A firm should reduce stock or improve credit terms
Share capital - shareholder funds provided to the business Profit for the Year £28,000
Reserves – increase in the value of a company often caused by Gearing Ratio- shows the ability of capital structure to pay
Dividends (£12,000)
shareholders allowing dividends to be kept. long-term debts, takeout new loans and a firm’s vulnerability
Retained Profit £16,000
to changes in interest rates.
Inventories £20,000 Accounting information: Non-Current Liabilities
Receivables £10,000 Capital expenditure allocation –money needed for future Gearing = Total Equity + Non-Current Liabilities X100
Cash £5,000
non-current assets
Total Current Assets £35,000 Borrowing is determined by asset value (security for bank). A
Stock valued at cost or net realisable value (value of stock in
Property £100,000 high gearing (over 50%) means a business is vulnerable to
Machinery £25,000 current state)- whichever is the lowest of the two.
Depreciation included giving a true valuation. Depreciation is changes in interest rates and reduces dividends. Low gearing
Total Non-Current Assets £125,000
an expense on the income statement of under 25% means the business isn’t taking a risk to expand
Overdraft (£2,000)
Payables (£30,000) Value & Limitations of Balance Sheets and Income Statements Financial Efficiency Ratios- assess efficiency of asset and
Unpaid Tax (£1,000) Stakeholders compare finances over time (trend analysis), short-term liability management.
Total Current Liabilities (£33,000) between departments (intra-firm), to an industry standard or
Bank Loan (£55,000) with competitors (inter-firm) so that: Shareholders/lenders can Cost of Sales
Inventory Turnover =
Total Non-Current Liabilities (£55,000) assess risk/return of an investment, employees can assess job Cost of Average Stock Held
Net Assets £72,000 security, suppliers can assess liquidity and customers can assess Shows how many times a business sold all its stock in a year.
Working Capital (Net Current Assets) £2,000 future survival (for after sale services) Holding less or selling more stock improves this ratio
Share Capital £60,000
Reserves £12,000
Payables
They ignore: skills, quality, market share, productivity, Payables Days = Cost of Sales X365
Total Equity £72,000 sustainability and PESTLE.
Net Assets = Total Assets – Total Liabilities = Total Equity PLCs publicise accounts, competitors can exploit weaknesses. Average number of days a business takes to pay suppliers.
Working Capital =Current Assets–Current Liabilities =Liquidity Balance sheets are a fixed point in the past and don’t include
Capital Employed = Total Equity + Non-Current Liabilities intangible assets, but may include bad debts – misleading. Receivables
Receivables Days = X365
Assets Employed = Non-Current Assets + Working Capital Income statements are distorted by inflation and seasonal Sales Revenue
Assets Employed = Capital Employed demand if not done over a 12 month period. Average number of days a business waits to be paid its credit.
Les avantages d'acheter des résumés chez Stuvia:
Qualité garantie par les avis des clients
Les clients de Stuvia ont évalués plus de 700 000 résumés. C'est comme ça que vous savez que vous achetez les meilleurs documents.
L’achat facile et rapide
Vous pouvez payer rapidement avec iDeal, carte de crédit ou Stuvia-crédit pour les résumés. Il n'y a pas d'adhésion nécessaire.
Focus sur l’essentiel
Vos camarades écrivent eux-mêmes les notes d’étude, c’est pourquoi les documents sont toujours fiables et à jour. Cela garantit que vous arrivez rapidement au coeur du matériel.
Foire aux questions
Qu'est-ce que j'obtiens en achetant ce document ?
Vous obtenez un PDF, disponible immédiatement après votre achat. Le document acheté est accessible à tout moment, n'importe où et indéfiniment via votre profil.
Garantie de remboursement : comment ça marche ?
Notre garantie de satisfaction garantit que vous trouverez toujours un document d'étude qui vous convient. Vous remplissez un formulaire et notre équipe du service client s'occupe du reste.
Auprès de qui est-ce que j'achète ce résumé ?
Stuvia est une place de marché. Alors, vous n'achetez donc pas ce document chez nous, mais auprès du vendeur SKing. Stuvia facilite les paiements au vendeur.
Est-ce que j'aurai un abonnement?
Non, vous n'achetez ce résumé que pour €3,67. Vous n'êtes lié à rien après votre achat.