Contemporary issues in finance
Chapter 1: Time series predictability
1.1 Introduction
Corporate finance 101 :
When do you accept a project?
o If NPV > 0
o Inititial investment plus the future cashflow of next year discounted back to today.
So you will do the project if the future cashflows outway the initial investment.
o How do you calculate NPV?
What does this mean?
Two components:
o Current and future cash-flows
o Discount rate (or expected returns) (or risk premia): The rate we use to discount the
future cashflows to get the NPV.
The expectation:
o Increase in current/future cash-flow leads to an increase in NPV: Ex. Higher dividend
will lead to a higher NPV or share price because investors will need to adapt their
expectations.
o Increase in discount rate leads to a decrease in NPV : The discount rate is the r in the
formula.
C1 C2 Ct
NPV C0 1
2
...
(1 r ) (1 r ) (1 r )t
Remark: On average people get 8% return on the stock market.
1.1.1 Stock returns
1. Simple net return : Average return
Why do we focus on returns?
Size does not matter: We will never talk about price, but about return because it measures
change.
Returns have more attractive properties, ergodicity and stationarity:
o Stationarity: It doesn’t if we look at the return last year or 2O years ago it will have
the same mean and variance (<> wealth 20 years ago will be different that wealth
yesterday)
Pt
Simple net return (price today divided by the price last period – 1-): Rt = −1
P t−1
Simple gross return: 1 + simple net return
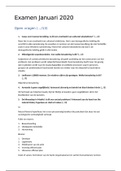
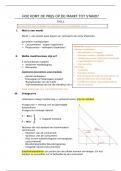
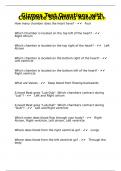
What is the annual return that we can expect? Simple net return for the stock exchange in brussels is
0,79%.
, 450
400
350
300
250
200
150
100
50
0
-0.2 -0.1 0 0.1 0.2 0.3 0.4 0.5
What can we see on this graph?
Normal distribution
Tails of the distribution : Right tail = good news, left tail = bad news.
o There are more incenses of tail behaviour than a normal distribution wants in their
property.
Let’s run a survey. Ask people how much return they should expect next year:
Expected return ignorant: if you can’t answer.
Risk ignorant: unable to answer question about high/low returns, etc.
If you expect a return above 30%: you are overly optimistic.
o Why is this important? Those people also start companies, if you don’t know what
return to expect, you also can’t answer what the NPV will be of a project.
o If you don’t know how risk works you will be out of business.
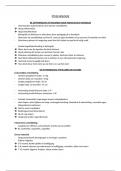
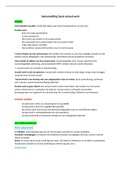
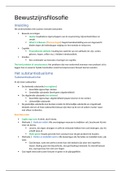
Graph: Relation between financial literacy and stock return ignorance. This figure presents the
relation between financial literacy and stock return ignorance. The cases of stock return ignorance
are defined as follows. Respondents are expected return ignorant if they cannot arrive at any
expected stock return at all. Risk ignorant respondents are those who are unable to answer the
question about high/low returns.
The more financial illiterate you are, the more ignorant you are.
o The % of people that are non ignorant, are more financial literate.
Setting expectations about risk and return correctly is very important:
Determinants of stock return ignorance: Not very important!
o Woman are more likely to be stock return ignorant, man are overconfident.
o Education: If you have a master, bachelor return you will be likely to be less stock
return ignorant.
o If you are return / risk ignorant, you are less likely to participate in the stock market.
,2. Excess return: Return that you get over and above the risk free rate.
There is a difference between the simple return on stocks (equity) and on bonds:
o This is called excess return
o You get a premium for the equity risk that you are taking.
This difference is called: excess return
Also known as the equity risk premium
Why does it exist? Disaster risk, habit formation,… no one really knows
o Why are stocks more volatile? People underestimate disaster risk ( if something
really bad happens in the economy stocks go down significantly) but overreact on the
disasters.
o Habit formation (only invest in money that you don’t need): If your income
decreases, you will still do a certain habit. People lose their job so they can’t invest in
the stock market anymore, consumption deviates so you don’t have extra money to
invest in specific stocks.
o Why do you get this premium? Nobody really knows.
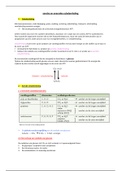
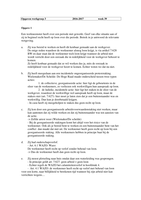
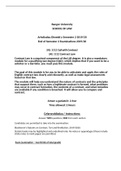
Graph: If you invested in 1801 you have more money when you invest in stocks than in
bonds.
o The gap between the stocks line and bonds line in the excess return.
o Stocks are super volatile (more than bonds), long time horizon is super important
when investing in stocks.
, Equity Premium and stock market volatility:
The average returns on stock is higher than the returns on short-term bonds.
Annualized estimated, based on monthly returns:
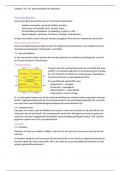
3. Risk-adjusted return:
Sharpe ratio: Adjusted the return you have for specific risk factors
Return of the portfolio– risk free return (germane 3 year bonds) divided by the standard
deviation of the portfolio’s excess return.
A decent measure of the risk-return trade-off is the Sharpe ratio: Return volatility
o Sharpe ratio measures risk and return: How much return did you get for the risk that
you took?
o The higher the ratio, the greater the investment return relative to the amount of risk
taken, and thus, the better the investment.
f
r t−r t
o The definition: SRt =
σ ( rt )
e
o If stock prices go up, there is volatility but it is good volatility. This ratio can not
separate good and bad volatility but takes into account both.
o You can also chose the time period in which you want to measure volatility.
Why should we care about this? Because it shows the risk or volatility that the investor took,
compared to the return.
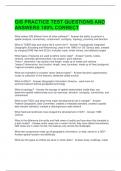
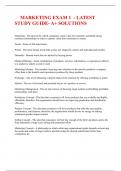
Graph: When should we invest in stocks?
Chapter 1: Time series predictability
1.1 Introduction
Corporate finance 101 :
When do you accept a project?
o If NPV > 0
o Inititial investment plus the future cashflow of next year discounted back to today.
So you will do the project if the future cashflows outway the initial investment.
o How do you calculate NPV?
What does this mean?
Two components:
o Current and future cash-flows
o Discount rate (or expected returns) (or risk premia): The rate we use to discount the
future cashflows to get the NPV.
The expectation:
o Increase in current/future cash-flow leads to an increase in NPV: Ex. Higher dividend
will lead to a higher NPV or share price because investors will need to adapt their
expectations.
o Increase in discount rate leads to a decrease in NPV : The discount rate is the r in the
formula.
C1 C2 Ct
NPV C0 1
2
...
(1 r ) (1 r ) (1 r )t
Remark: On average people get 8% return on the stock market.
1.1.1 Stock returns
1. Simple net return : Average return
Why do we focus on returns?
Size does not matter: We will never talk about price, but about return because it measures
change.
Returns have more attractive properties, ergodicity and stationarity:
o Stationarity: It doesn’t if we look at the return last year or 2O years ago it will have
the same mean and variance (<> wealth 20 years ago will be different that wealth
yesterday)
Pt
Simple net return (price today divided by the price last period – 1-): Rt = −1
P t−1
Simple gross return: 1 + simple net return
What is the annual return that we can expect? Simple net return for the stock exchange in brussels is
0,79%.
, 450
400
350
300
250
200
150
100
50
0
-0.2 -0.1 0 0.1 0.2 0.3 0.4 0.5
What can we see on this graph?
Normal distribution
Tails of the distribution : Right tail = good news, left tail = bad news.
o There are more incenses of tail behaviour than a normal distribution wants in their
property.
Let’s run a survey. Ask people how much return they should expect next year:
Expected return ignorant: if you can’t answer.
Risk ignorant: unable to answer question about high/low returns, etc.
If you expect a return above 30%: you are overly optimistic.
o Why is this important? Those people also start companies, if you don’t know what
return to expect, you also can’t answer what the NPV will be of a project.
o If you don’t know how risk works you will be out of business.
Graph: Relation between financial literacy and stock return ignorance. This figure presents the
relation between financial literacy and stock return ignorance. The cases of stock return ignorance
are defined as follows. Respondents are expected return ignorant if they cannot arrive at any
expected stock return at all. Risk ignorant respondents are those who are unable to answer the
question about high/low returns.
The more financial illiterate you are, the more ignorant you are.
o The % of people that are non ignorant, are more financial literate.
Setting expectations about risk and return correctly is very important:
Determinants of stock return ignorance: Not very important!
o Woman are more likely to be stock return ignorant, man are overconfident.
o Education: If you have a master, bachelor return you will be likely to be less stock
return ignorant.
o If you are return / risk ignorant, you are less likely to participate in the stock market.
,2. Excess return: Return that you get over and above the risk free rate.
There is a difference between the simple return on stocks (equity) and on bonds:
o This is called excess return
o You get a premium for the equity risk that you are taking.
This difference is called: excess return
Also known as the equity risk premium
Why does it exist? Disaster risk, habit formation,… no one really knows
o Why are stocks more volatile? People underestimate disaster risk ( if something
really bad happens in the economy stocks go down significantly) but overreact on the
disasters.
o Habit formation (only invest in money that you don’t need): If your income
decreases, you will still do a certain habit. People lose their job so they can’t invest in
the stock market anymore, consumption deviates so you don’t have extra money to
invest in specific stocks.
o Why do you get this premium? Nobody really knows.
Graph: If you invested in 1801 you have more money when you invest in stocks than in
bonds.
o The gap between the stocks line and bonds line in the excess return.
o Stocks are super volatile (more than bonds), long time horizon is super important
when investing in stocks.
, Equity Premium and stock market volatility:
The average returns on stock is higher than the returns on short-term bonds.
Annualized estimated, based on monthly returns:
3. Risk-adjusted return:
Sharpe ratio: Adjusted the return you have for specific risk factors
Return of the portfolio– risk free return (germane 3 year bonds) divided by the standard
deviation of the portfolio’s excess return.
A decent measure of the risk-return trade-off is the Sharpe ratio: Return volatility
o Sharpe ratio measures risk and return: How much return did you get for the risk that
you took?
o The higher the ratio, the greater the investment return relative to the amount of risk
taken, and thus, the better the investment.
f
r t−r t
o The definition: SRt =
σ ( rt )
e
o If stock prices go up, there is volatility but it is good volatility. This ratio can not
separate good and bad volatility but takes into account both.
o You can also chose the time period in which you want to measure volatility.
Why should we care about this? Because it shows the risk or volatility that the investor took,
compared to the return.
Graph: When should we invest in stocks?