Sensation & Perception
H1 Introduction
Welcome to Our World
Sensation and Perception – Your own sensory experience is directly accessible
only to you. The ability to detect a stimulus (pressure of a finger) and, perhaps,
to turn that detection into a private experience is the meaning of sensation.
Perception can be thought of as the act of giving meaning and/or purpose to
those detected sensations. For example: how do you understand the finger that
runs down your back?
Everything we feel, think, and do depends on sensations and perceptions.
Condillac: if our mental life depends on information from our senses, then it
follows that the place for the study of the senses is within the science of human
behavior and human mental life (within psychology). There are an array of
methods used in the study of the senses:
-Method 1: Thresholds
Thresholds and the Dawn of Psychophysics
Fechner is sometimes considered to be the true founder of experimental
psychology. He became absorbed with the relationship between mind and
matter. This placed him in the philosophical debate between dualism: The idea
that the mind has an existence separate from the material world of the body; and
materialism: The idea that the only thing that exists is matter, and that all
things, including the mind and consciousness, are the results of interaction
between bits of matter. A modern materialist position (the majority view in
scientific psychology) is that the mind is what the brain does. Fechner proposed
to effectively split the difference by imagining that the mind, or consciousness, is
present in all of nature. This panpsychism – the idea that the mind exists as a
property of all matter (all matter has consciousness) – extended not only to
animals, but to inanimate things as well. Fechner thought it should be possible to
describe the relation between mind and body using mathematics. His goal was to
formally describe the relationship between sensation (mind) and the energy
(matter) that gave rise to that sensation. He called both his methods and his
theory psychophysics (the science of defining quantitative relationships
between physical and psychological (subjective) events). Fechner was inspired by
Weber, who tested the accuracy of our sense of touch by using a device much
like the compass one might use to draw circles. He used this to measure the
smallest distance between two points that was required for a person to feel touch
on two points instead of one. Fechner would call the distance between the points
the two-point touch threshold. For Fechner, Weber’s most important findings
involved judgments of lifted weights. The ability of a person to detect the
difference between the standard and comparison weights depended greatly on
the weight of the standard. When the standard was relatively light, people were
much better at detecting a small difference when they lifted a comparison
weight. When the standard was heavier, people needed a bigger difference
before they could detect a change. The difference required for detecting a
change in weight was called the just noticeable difference (JND) or the
difference threshold. Weber found that JNDs changed in a systematic way
(always close to 1/40). For virtually every measure a constant ratio between the
change and the standard could describe the threshold of detectable change quite
well. This ratio rule holds true except when intensities, size, and so on are very
small or large, nearing the minimum and maximum of our senses. Fechner called
these ratios Weber fractions.
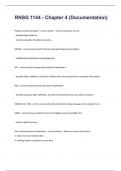
Fechner named the general rule – that the size of the detectable difference (ΔI) is
a constant proportion (K) of the level of the stimulus (I) – Weber’s law. Fechner
assumed that the smallest detectable change in a stimulus (ΔI) could be
,considered a unit of the mind because this is the smallest bit of change that is
perceived. He then mathematically extended Weber’s law to create what became
known as Fechner’s law: S= k log R. Where S is the psychological sensation,
which is equal to the logarithm of the physical stimulus level (log R) multiplied by
a constant, k. This describes the fact that our psychological experience of the
intensity of light, sound, smell, taste, or touch increases less quickly than the
actual physical stimulus increases. This formally demonstrated a relationship
between psyche and physics (psychophysics).
There’s a similarity between Fechner’s law and Albert Einstein’s famous equation:
E = mc². Like mind and body, energy (E) and mass (m) had, been thought of as
distinct things. Fechner provided us with at least one way to equate mind and
matter.
*Frequency is a measure of a physical phenomenon, while pitch describes a
psychophysical response to that physical phenomenon. Frequency and pitch are
not the same thing, but they are closely correlated. As frequency increases, so
does pitch, though it is unclear whether there is a perception of pitch for high
frequencies.
An absolute threshold is the minimum intensity of a stimulus that can be
detected.
Psychophysical Methods – One method to measure an absolute threshold in a
valid and reliable manner is known as the method of constant stimuli. This
method requires creating many stimuli with different intensities in order to find
the tiniest intensity that can be detected (for example: hearing test). The
“multiple times” piece is important. Subtle perceptual judgments (e.g., threshold
judgments) are variable. The stimulus varies for physical reasons. The observer
varies. Attention waivers and sensory systems fluctuate for all sorts of reasons.
As a consequence, one measure is almost never enough. You need to repeat the
measure over and over and then average responses or otherwise describe the
pattern of results. If you do a hearing test you would report whether you heard a
tone or not. You would always report hearing a tone that was relatively far above
threshold, and almost never report hearing a tone that was well below threshold.
In between however, you would be more likely to hear some tone intensities than
not to hear them, and you would hear other, lower intensities on only a few
presentations. In general, the intensity at which a stimulus would be detected
50% of the time would be chosen as your threshold. It turns out that a boundary
of a value below which we just can’t hear anything, doesn’t exist. Because of
variability in the nervous system, stimuli near threshold will be detected
sometimes and missed at other times. As a result, the function relating the
probability of detection with the stimulus level will be more gradual and we must
settle for a somewhat arbitrary definition of an absolute threshold.
The method of constant stimuli is simple to use, but it is an inefficient way to
conduct an experiment, because much of the listener’s time is spent with stimuli
that are clearly well above or below threshold. A more efficient approach is the
method of limits. With this method, the experimenter begins with the same set
of stimuli – in this case, tones that vary in intensity. Instead of random
presentations, tones are presented in order of increasing or decreasing intensity.
When tones are presented in ascending order, from faintest to loudest, listeners
are asked to report when they first hear the tone. With descending order, the
task is to report when the tone is no longer audible. There is some overshoot in
judgments: it usually takes more intensity to report hearing the tone when
intensity is increasing, and it takes more decreases in intensity before a listener
reports that the tone cannot be heard. We take the average of these crossover
,points – when listeners shift from reporting hearing the tone to not and vice versa
– to be the threshold.
The third and final measures of thresholds is the method of adjustment. This
method is just like the method of limits, except the person being tested is the
one who steadily increases or decreases the intensity of the stimulus. This may
be the easiest method to understand (it is much like day-to-day activities). But it
is not usually used to measure thresholds. The same person will adjust a dial to
different places on different trials, and measurements get even messier when we
try to combine the data from multiple people.
-Method 2: Scaling – measuring private experience
When you hear or taste something, are those experiences (qualia) the same
as the experiences of the person you’re talking to? We have no direct way to
experience someone else’s experiences. However, we can demonstrate that
different people do, in some cases, inhabit different sensory worlds.
If you want to know how strong your experiences are (show a light and ask how
much additional light you would need to make another light look twice as bright)
is to simply ask the observers to rate the experience. This method is called
magnitude estimation (A psychophysical method in which the participant
assigns values according to perceived magnitudes of the stimuli). This approach
works well, even when observers are free to choose their own range of numbers
(responses can be scales sensibly above or below a standard, 10 for example.
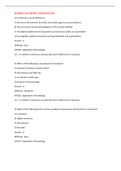
The relationship between stimulus intensity and sensation is described by what is
now knowns as Steven’s power law: S = a I b. The sensation (S) is related to the
stimulus intensity (I) by an exponent (b). a is a constant that corrects for the
units you are using (for example: from meters to centimeters). If the exponent is
less than 1, this means that the sensation grows less rapidly than the stimulus
(Fechner’s and Weber’s law would predict this). If you started with 1 candle, the
change from 1 to 11 candles must be quite dramatic. But add 10 to 100 the
change will be modes, adding 10 to 10,000 won’t even be noticeable. For
brightness the exponent is about 0.3, sweetness 0.8 and length near 1. This
relationship is true over only a moderate range of sizes: inch added to the size of
a spider changes your sensory experience much more than an inch added to the
height of a giraffe. With an electric shock, the pain grows with 3.5.
Weber’s law involves a clear objective measurement. We know how much
we varied the stimulus, and either the observers can tell that the stimulus
changed, or they cannot.
Fechner’s law begins with the same sort of objective measurements as
Weber’s, but the law is actually a calculation based on some assumptions
about how sensation works. In particular, Fechner’s law assumes that all
JNDs are perceptually equivalent. In fact, this assumption turns out to be
incorrect and leads to some places where the law is violated, such as in
the electric shock example.
Steven’s power law describes rating data quite well but notice that rating
data are qualitatively different from the data that supported Weber’s law.
We can record the observer’s ratings and we can check whether those
ratings are reasonable and consistent, but there is no way to know
whether they are objectively right or wrong.
A useful variant of the scaling method can show us that different individuals can
live in different sensory worlds, even if they are exposed to the same stimulus:
cross-modality matching. An observer adjusts a stimulus of one sort to match
the perceived magnitude of a stimulus of a completely different sort (adjust the
brightness of a light until it matches the loudness of a particular tone – everyone
with normal vision and hearing will produce the same pattern of matches of a
, sound to a light). The relationship of visual experience and auditory experience
appears to be similar across individuals. This is not so when it comes to the sense
of taste. There’s a molecule, PROP, that some people experience as very bitter,
while others experience it as almost tasteless. And others fall in between. This
relationship can be examined formally with cross-modality matching. Some
people – nontasters – match the taste of PROP to very weak sensations like the
sound of a watch or a whisper. Supertasters assert the bitterness of PROP as
similar in intensity to the brightness of the sun or the most intense pain ever
experienced. Medium tasters match it to the smell of frying bacon or the pain of a
mild headache. There’s a genetic basis for this variation.
-Method 3: Signal detection theory – measuring difficult decisions
The fact that thresholds are not absolute is an important way to think about and
to deal with it experimentally is known as signal detection theory. It begins
with the fact that the stimulus you’re trying to detect (the “signal”) is always
being detected in the presence of “noise”. The static in your nervous system is
the internal noise. When you’re trying to detect a faint sound or flash of light, you
must be able to detect it in the presence of that internal noise (closed eyes, and
still see something; no noise, but still hear something). Down near threshold, it
will be hard to tell a real stimulus from a surge of internal noise. There is external
noise too (sometimes they both are not a problem -> have smaller magnitude).
Signal detection theory exists to help us understand what’s going on when we
make decisions under conditions of uncertainty.
A criterion, in SDT is a value that is somehow (thus automatic) determined by the
observer. By knowing the relationship of hits to false alarms, you can calculate a
sensitivity measure knowns ad d’. Which could be about zero if the distributions
are on top of each other. And it’s large with a high sensitivity. For a fixed value of
d’, changing the criterion changes the hits and false alarms in predictable ways.
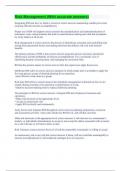
If you plot false alarms on the x-axis of a graph against hits on the y-axis for
different criterion values, you get a curve known as receiver operating
characteristic (ROC) curve. If you moved your criterion and guessed “yes” on
80% of phone-present occasions, you would also guess “yes” on 80% of phone-
absent occasions (same as with 40%). Your data would fall on the “chance
performance” diagonal. If you were perfect, you would have 100% hits and 0%
false alarms, and your data point would lie at the upper left corner. If your data
lie below the chance line, you did the experiment wrong. The criterion of ROC
curve can slide up and to the right, you will make more hits but also more false
alarms. Or down and to the left, you will have fewer false alarms but more
misses. Where you place a criterion will depend on many factors.
Fourier Analysis – Fourier developed analyses that help modern perception
scientists to better describe how complex sounds such as music and speech,
complex head motions, and complex images can be decomposed into a set of
simpler components.
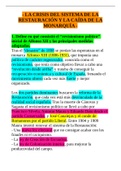
One of the simplest kinds of sounds is a sine wine (hearing a pure tone). Air
pressure in a sine wave changes continuously (sinusoidally) at one frequency.
The time taken for one complete cycle of a sine wave, or for a wavelength to
pass a point, is the period of the sine wave. The height of the wave is its
amplitude (volume van geluid). The phase of the wave is its position relative to a
fixed marker and is measured in degrees (360 degrees of phase across one
period).
Sine waves are not common, everyday sounds, because few vibrations in the
world are so pure (tuning forks, flutes). But it turns out that all sounds, no matter
how complex, can be described as a combination of sine waves. Fourier proved
H1 Introduction
Welcome to Our World
Sensation and Perception – Your own sensory experience is directly accessible
only to you. The ability to detect a stimulus (pressure of a finger) and, perhaps,
to turn that detection into a private experience is the meaning of sensation.
Perception can be thought of as the act of giving meaning and/or purpose to
those detected sensations. For example: how do you understand the finger that
runs down your back?
Everything we feel, think, and do depends on sensations and perceptions.
Condillac: if our mental life depends on information from our senses, then it
follows that the place for the study of the senses is within the science of human
behavior and human mental life (within psychology). There are an array of
methods used in the study of the senses:
-Method 1: Thresholds
Thresholds and the Dawn of Psychophysics
Fechner is sometimes considered to be the true founder of experimental
psychology. He became absorbed with the relationship between mind and
matter. This placed him in the philosophical debate between dualism: The idea
that the mind has an existence separate from the material world of the body; and
materialism: The idea that the only thing that exists is matter, and that all
things, including the mind and consciousness, are the results of interaction
between bits of matter. A modern materialist position (the majority view in
scientific psychology) is that the mind is what the brain does. Fechner proposed
to effectively split the difference by imagining that the mind, or consciousness, is
present in all of nature. This panpsychism – the idea that the mind exists as a
property of all matter (all matter has consciousness) – extended not only to
animals, but to inanimate things as well. Fechner thought it should be possible to
describe the relation between mind and body using mathematics. His goal was to
formally describe the relationship between sensation (mind) and the energy
(matter) that gave rise to that sensation. He called both his methods and his
theory psychophysics (the science of defining quantitative relationships
between physical and psychological (subjective) events). Fechner was inspired by
Weber, who tested the accuracy of our sense of touch by using a device much
like the compass one might use to draw circles. He used this to measure the
smallest distance between two points that was required for a person to feel touch
on two points instead of one. Fechner would call the distance between the points
the two-point touch threshold. For Fechner, Weber’s most important findings
involved judgments of lifted weights. The ability of a person to detect the
difference between the standard and comparison weights depended greatly on
the weight of the standard. When the standard was relatively light, people were
much better at detecting a small difference when they lifted a comparison
weight. When the standard was heavier, people needed a bigger difference
before they could detect a change. The difference required for detecting a
change in weight was called the just noticeable difference (JND) or the
difference threshold. Weber found that JNDs changed in a systematic way
(always close to 1/40). For virtually every measure a constant ratio between the
change and the standard could describe the threshold of detectable change quite
well. This ratio rule holds true except when intensities, size, and so on are very
small or large, nearing the minimum and maximum of our senses. Fechner called
these ratios Weber fractions.
Fechner named the general rule – that the size of the detectable difference (ΔI) is
a constant proportion (K) of the level of the stimulus (I) – Weber’s law. Fechner
assumed that the smallest detectable change in a stimulus (ΔI) could be
,considered a unit of the mind because this is the smallest bit of change that is
perceived. He then mathematically extended Weber’s law to create what became
known as Fechner’s law: S= k log R. Where S is the psychological sensation,
which is equal to the logarithm of the physical stimulus level (log R) multiplied by
a constant, k. This describes the fact that our psychological experience of the
intensity of light, sound, smell, taste, or touch increases less quickly than the
actual physical stimulus increases. This formally demonstrated a relationship
between psyche and physics (psychophysics).
There’s a similarity between Fechner’s law and Albert Einstein’s famous equation:
E = mc². Like mind and body, energy (E) and mass (m) had, been thought of as
distinct things. Fechner provided us with at least one way to equate mind and
matter.
*Frequency is a measure of a physical phenomenon, while pitch describes a
psychophysical response to that physical phenomenon. Frequency and pitch are
not the same thing, but they are closely correlated. As frequency increases, so
does pitch, though it is unclear whether there is a perception of pitch for high
frequencies.
An absolute threshold is the minimum intensity of a stimulus that can be
detected.
Psychophysical Methods – One method to measure an absolute threshold in a
valid and reliable manner is known as the method of constant stimuli. This
method requires creating many stimuli with different intensities in order to find
the tiniest intensity that can be detected (for example: hearing test). The
“multiple times” piece is important. Subtle perceptual judgments (e.g., threshold
judgments) are variable. The stimulus varies for physical reasons. The observer
varies. Attention waivers and sensory systems fluctuate for all sorts of reasons.
As a consequence, one measure is almost never enough. You need to repeat the
measure over and over and then average responses or otherwise describe the
pattern of results. If you do a hearing test you would report whether you heard a
tone or not. You would always report hearing a tone that was relatively far above
threshold, and almost never report hearing a tone that was well below threshold.
In between however, you would be more likely to hear some tone intensities than
not to hear them, and you would hear other, lower intensities on only a few
presentations. In general, the intensity at which a stimulus would be detected
50% of the time would be chosen as your threshold. It turns out that a boundary
of a value below which we just can’t hear anything, doesn’t exist. Because of
variability in the nervous system, stimuli near threshold will be detected
sometimes and missed at other times. As a result, the function relating the
probability of detection with the stimulus level will be more gradual and we must
settle for a somewhat arbitrary definition of an absolute threshold.
The method of constant stimuli is simple to use, but it is an inefficient way to
conduct an experiment, because much of the listener’s time is spent with stimuli
that are clearly well above or below threshold. A more efficient approach is the
method of limits. With this method, the experimenter begins with the same set
of stimuli – in this case, tones that vary in intensity. Instead of random
presentations, tones are presented in order of increasing or decreasing intensity.
When tones are presented in ascending order, from faintest to loudest, listeners
are asked to report when they first hear the tone. With descending order, the
task is to report when the tone is no longer audible. There is some overshoot in
judgments: it usually takes more intensity to report hearing the tone when
intensity is increasing, and it takes more decreases in intensity before a listener
reports that the tone cannot be heard. We take the average of these crossover
,points – when listeners shift from reporting hearing the tone to not and vice versa
– to be the threshold.
The third and final measures of thresholds is the method of adjustment. This
method is just like the method of limits, except the person being tested is the
one who steadily increases or decreases the intensity of the stimulus. This may
be the easiest method to understand (it is much like day-to-day activities). But it
is not usually used to measure thresholds. The same person will adjust a dial to
different places on different trials, and measurements get even messier when we
try to combine the data from multiple people.
-Method 2: Scaling – measuring private experience
When you hear or taste something, are those experiences (qualia) the same
as the experiences of the person you’re talking to? We have no direct way to
experience someone else’s experiences. However, we can demonstrate that
different people do, in some cases, inhabit different sensory worlds.
If you want to know how strong your experiences are (show a light and ask how
much additional light you would need to make another light look twice as bright)
is to simply ask the observers to rate the experience. This method is called
magnitude estimation (A psychophysical method in which the participant
assigns values according to perceived magnitudes of the stimuli). This approach
works well, even when observers are free to choose their own range of numbers
(responses can be scales sensibly above or below a standard, 10 for example.
The relationship between stimulus intensity and sensation is described by what is
now knowns as Steven’s power law: S = a I b. The sensation (S) is related to the
stimulus intensity (I) by an exponent (b). a is a constant that corrects for the
units you are using (for example: from meters to centimeters). If the exponent is
less than 1, this means that the sensation grows less rapidly than the stimulus
(Fechner’s and Weber’s law would predict this). If you started with 1 candle, the
change from 1 to 11 candles must be quite dramatic. But add 10 to 100 the
change will be modes, adding 10 to 10,000 won’t even be noticeable. For
brightness the exponent is about 0.3, sweetness 0.8 and length near 1. This
relationship is true over only a moderate range of sizes: inch added to the size of
a spider changes your sensory experience much more than an inch added to the
height of a giraffe. With an electric shock, the pain grows with 3.5.
Weber’s law involves a clear objective measurement. We know how much
we varied the stimulus, and either the observers can tell that the stimulus
changed, or they cannot.
Fechner’s law begins with the same sort of objective measurements as
Weber’s, but the law is actually a calculation based on some assumptions
about how sensation works. In particular, Fechner’s law assumes that all
JNDs are perceptually equivalent. In fact, this assumption turns out to be
incorrect and leads to some places where the law is violated, such as in
the electric shock example.
Steven’s power law describes rating data quite well but notice that rating
data are qualitatively different from the data that supported Weber’s law.
We can record the observer’s ratings and we can check whether those
ratings are reasonable and consistent, but there is no way to know
whether they are objectively right or wrong.
A useful variant of the scaling method can show us that different individuals can
live in different sensory worlds, even if they are exposed to the same stimulus:
cross-modality matching. An observer adjusts a stimulus of one sort to match
the perceived magnitude of a stimulus of a completely different sort (adjust the
brightness of a light until it matches the loudness of a particular tone – everyone
with normal vision and hearing will produce the same pattern of matches of a
, sound to a light). The relationship of visual experience and auditory experience
appears to be similar across individuals. This is not so when it comes to the sense
of taste. There’s a molecule, PROP, that some people experience as very bitter,
while others experience it as almost tasteless. And others fall in between. This
relationship can be examined formally with cross-modality matching. Some
people – nontasters – match the taste of PROP to very weak sensations like the
sound of a watch or a whisper. Supertasters assert the bitterness of PROP as
similar in intensity to the brightness of the sun or the most intense pain ever
experienced. Medium tasters match it to the smell of frying bacon or the pain of a
mild headache. There’s a genetic basis for this variation.
-Method 3: Signal detection theory – measuring difficult decisions
The fact that thresholds are not absolute is an important way to think about and
to deal with it experimentally is known as signal detection theory. It begins
with the fact that the stimulus you’re trying to detect (the “signal”) is always
being detected in the presence of “noise”. The static in your nervous system is
the internal noise. When you’re trying to detect a faint sound or flash of light, you
must be able to detect it in the presence of that internal noise (closed eyes, and
still see something; no noise, but still hear something). Down near threshold, it
will be hard to tell a real stimulus from a surge of internal noise. There is external
noise too (sometimes they both are not a problem -> have smaller magnitude).
Signal detection theory exists to help us understand what’s going on when we
make decisions under conditions of uncertainty.
A criterion, in SDT is a value that is somehow (thus automatic) determined by the
observer. By knowing the relationship of hits to false alarms, you can calculate a
sensitivity measure knowns ad d’. Which could be about zero if the distributions
are on top of each other. And it’s large with a high sensitivity. For a fixed value of
d’, changing the criterion changes the hits and false alarms in predictable ways.
If you plot false alarms on the x-axis of a graph against hits on the y-axis for
different criterion values, you get a curve known as receiver operating
characteristic (ROC) curve. If you moved your criterion and guessed “yes” on
80% of phone-present occasions, you would also guess “yes” on 80% of phone-
absent occasions (same as with 40%). Your data would fall on the “chance
performance” diagonal. If you were perfect, you would have 100% hits and 0%
false alarms, and your data point would lie at the upper left corner. If your data
lie below the chance line, you did the experiment wrong. The criterion of ROC
curve can slide up and to the right, you will make more hits but also more false
alarms. Or down and to the left, you will have fewer false alarms but more
misses. Where you place a criterion will depend on many factors.
Fourier Analysis – Fourier developed analyses that help modern perception
scientists to better describe how complex sounds such as music and speech,
complex head motions, and complex images can be decomposed into a set of
simpler components.
One of the simplest kinds of sounds is a sine wine (hearing a pure tone). Air
pressure in a sine wave changes continuously (sinusoidally) at one frequency.
The time taken for one complete cycle of a sine wave, or for a wavelength to
pass a point, is the period of the sine wave. The height of the wave is its
amplitude (volume van geluid). The phase of the wave is its position relative to a
fixed marker and is measured in degrees (360 degrees of phase across one
period).
Sine waves are not common, everyday sounds, because few vibrations in the
world are so pure (tuning forks, flutes). But it turns out that all sounds, no matter
how complex, can be described as a combination of sine waves. Fourier proved