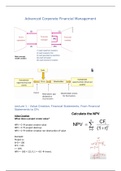
Advanced Corporate Financial Management
Lecture 1 – Value Creation, Financial Statements, From Financial
Statements to CFs
Value Creation
When does a project create value?
NPV > 0 project creates value
NPV < 0 project destroys
NPV = 0 neither creation nor destruction of value
Example:
Project A:
It=0 = 100
CF1 = 121
r = 10%
NPV = -100 + 121/1.1 = +10 Invest.
,Difference of 11 (21% vs 10%) EVA. Difference of 10 (11/(1+r)) MVA. MVA = NPV.
Market value vs Book value ->
Project B:
It=0 = 100
CF1 = 109
r = 10%
NPV = -100 + 109/1.1 = -0.91 Don’t invest
Market Value Added (MVA) and Economic Value Added (EVA)
Value = Present value of the expected Free Cash Flows
Value = PV E(FCF)
Special case:
Value0= FCF1/ (WACC – g)
*WACC = Weighted Average Cost of Capital
Example:
, With an investment rate of
40% instead of 25%, value
increases further. Because
the return is higher than
the required rate of return.
If the ROIC > WACC, then an increase in growth, results in an increase in firm value.
ROIC = 20% while the WACC = 12%.
Now, what if WACC = 25%?
Let’s go back to situation 1 first, where the
growth rate was 5% and the WACC 12%.
Realised return is below the required return (25%),
value of the firm goes down. (500-125=375).
If you invest more in this project, value of the firm will decrease further. The impact of the
lower cashflow is relatively higher compared to the growth rate on the value of the firm.
Conclusion:
- If ROIC > WACC, investment in growth increases the value of the firm.
- If ROIC < WACC, investment in growth decreases the value of the firm.
- And... if ROIC = WACC, investment in growth is irrelevant for the value of the firm.
Note that the difference between the Market Value and the Invested Capital is the Market
Value Added (MVA).
Financial statements
Definitions:
The balance sheet provides a snapshot of the company’s assets on the one hand and a
company’s equity and liabilities on the other. Is like a photo, certain moment in time.
- “The assets show how the firm uses its capital (its investments), and the other side
summarizes the sources of capital, or how a firm raises the money it needs.” BDM,
p.21.
- Examples of assets: cash, buildings, inventories, accounts receivable.
- Examples of liabilities: loan from a bank, accounts payable.
The income statement or Profit and Loss statement (P&L) shows the revenues and costs
over the past period. Like a film or scoreboard, over a period of time.
,The impact of Financial facts on Balance sheet and P&L:
2 Jan.
X buys a machine
for 400 and pays
in cash
(depreciated to
zero in 10 years
straight line).
3 Jan.
X buys products (inventories) for 500 and receives the invoice.
12 Feb.
X sells 50% of the products for 800 (cogs is 250);
600 is received immediately, the residual 200 will be paid later.
15 Mar.
X receives the other 200 from its clients.
4 Apr.
X pays suppliers 500.
15 May
X buys products (inventories) for 750 and receives invoice.
10 Nov.
X sells 40% of the products for 1250
(cogs is 400);
800 is received immediately,
the residual of 450 will be paid later.
31 Dec.
Fixed assets are depreciated with
40.
For step-by-step, see video 1.3
Profit goes up by 1,360, cash only 700
Cashflow statement:
The cashflow statement explains why cash went up from 1,000 to 1,700
while the income statement explains why equity went up from 1,000 to
2,360.
, From financial statements to CFs
When valuing a company, you look at the Balance sheet and Income statement. Based on
that, you derive the Cashflow statement, which you can use to derive the Free Cashflow.
Free CF = Operating CF – investments –
taxes (as if you have no debt).
Even though there is a positive net
income, FCF is negative (partly due to
large investments).