
Cursos populares 'MATH110 Statistics' en [*INSTITUCIÓN*]
MATH110 Statistics - Guías de estudio, Notas de estudios & Resúmenes
¿Buscas las mejores guías de estudio, notas de estudio y resúmenes para MATH110 Statistics? En esta página encontrarás 4 documentos de estudio para MATH110 Statistics.
Examen
Math110 Statistics Final Exam: Portage Learning Actual Exam Updated 2026 Graded A+
This MATH110 Statistics Final Exam study guide for Portage Learning includes comprehensive practice questions, step-by-step solutions, and key statistical concepts. Covers descriptive statistics, probability, hypothesis testing, and regression. Designed for 2026 exam preparation, revision, and concept mastery. Ideal for students aiming to strengthen understanding and improve exam performance.
 DrREED
Examen
Math110 Statistics Final Exam: Portage Learning Actual Exam Updated 2024 Graded A+
PopularMath110 Statistics Final Exam: Portage Learning Actual Exam Updated 2024 Graded A+ Math110 Statistics Final Exam: Portage Learning Actual Exam Updated 2024 Graded A+ Math110 Statistics Final Exam: Portage Learning Actual Exam Updated 2024 Graded A+
 Topexpert
Examen
MATH 110 Final Exam (New-2023) / MATH110 Final Exam/ MATH 110 Statistics Final Exam/ MATH110 Statistics Final Exam: Portage Learning (Already graded A+)
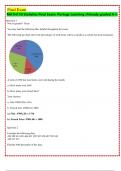
xam MATH110 Statistics Final Exam: Portage Learning (Already graded A+) Question 1 Not yet graded / 10 pts You may find the following files helpful throughout the exam: The following pie chart shows the percentages of total items sold in a month in a certain fast food restaurant. A total of 4700 fast food items were sold during the month. a.) How many were fish? b.) How many were french fries? Your Answer: a. fish 4700(0.28)=1316 b. French fries 4700(0.4)=1880 a.) Fish : 47...
 chrismaishndirangu
Examen
MATH 110 Final Exam (New-2023) / MATH110 Final Exam/ MATH 110 Statistics Final Exam/ MATH110 Statistics Final Exam: Portage Learning (Already graded A+)
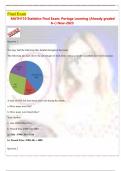
Final Exam MATH110 Statistics Final Exam: Portage Learning (Already graded A+) New-2023 Question 1 You may find the following files helpful throughout the exam: The following pie chart shows the percentages of total items sold in a month in a certain fast food restaurant. A total of 4700 fast food items were sold during the month. a.) How many were fish? b.) How many were french fries? Your Answer: a. fish 4700(0.28)=1316 b. French fries 4700(0.4)=1880 a.) Fish : 4700(...
 Academicaffairs