Bus 140 SJSU - Guías de estudio, Notas de estudios & Resúmenes

¿Buscas las mejores guías de estudio, notas de estudio y resúmenes para Bus 140 SJSU? En esta página encontrarás 7 documentos de estudio para Bus 140 SJSU.

All 7 resultados

Ordenador por:
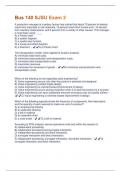
Bus 140 SJSU Exam 2 Questions and  Correct Verified Answers Latest Version
  • Examen

    Bus 140 SJSU Exam 2 Questions and Correct Verified Answers Latest Version

  • ___ is used to rank a company's products to determine which products represent the best use of the firm's resources, or, perhaps, to determine which products are to be eliminated. A) Value analysis B) Value engineering C) Financial analysis D) Product-by-value analysis E) Product cost justification D) Product-by-value analysis Which of the following is true regarding value engineering? A) Value engineering occurs only after the product is selected and designed. B) Value engi...
  • Axpert
    $11.99 Más información
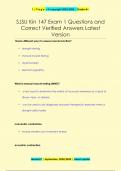
Bus 140 SJSU Exam 2 questions and  answers
  • Examen

    Bus 140 SJSU Exam 2 questions and answers

  • Bus 140 SJSU Exam 2 questions and answers ________ is used to rank a company's products to determine which products represent the best use of the firm's resources, or, perhaps, to determine which products are to be eliminated. A) Value analysis B) Value engineering C) Financial analysis D) Product-by-value analysis E) Product cost justificationD) Product-by-value analysis Which of the following is true regarding value engineering? A) Value engineering occurs only ...
  • ExamZen
    $8.49 Más información
Bus 140 SJSU Exam 2 Questions + Answers Graded A+
  • Examen

    Bus 140 SJSU Exam 2 Questions + Answers Graded A+

  • A production manager at a pottery factory has noticed that about 70 percent of defects result from impurities in raw materials, 15 percent result from human error, 10 percent from machine malfunctions, and 5 percent from a variety of other causes. This manager is most likely using: ____ A) a Pareto chart. B) a scatter diagram. C) a quality loss function. D) a cause-and-effect diagram. E) a flowchart. - ️️A) a Pareto chart. The transportation model, when applied to location analysis:...
  • Brainarium
    $8.89 Más información
Y así es como ganas dinero extra
¿Sabías que, de media, un vendedor en Stuvia gana 76 euros al mes con la venta de recursos de estudio? Hmm, pista, pista.