STATISTICS
Las últimas cargas en STATISTICS. ¿Buscando notas en STATISTICS? Tenemos muchas notas, guias de estudio y notas de estudio disponsible para tu escuela.
-
744
- 0
-
37
All courses for STATISTICS
-
Statistics 744
-
Statistics / 1
-
Statistics 1
-
STATISTICS, 2
-
Statistics: 1
-
Statistics/ 5
-
Statistics/////// 1
Último contenido STATISTICS
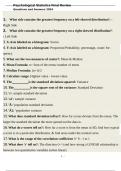
Psychological Statistics Final Review Questions and Answers 2024 46. How do you find the area under the curve (by hand)?: The 'or' rule: P(A or B or ...etc) = P(A) + P(B) + etc 47. The normal distribution is like a because all the probabilities have to add up to .: Sample space, 1
- Package deal
- Examen
- • 5 páginas's •
-
Statistics•Statistics
-
Statistics| Calculus| Homework exam elaborations bundle• Porsmartchoices
Vista previa 2 fuera de 5 páginas
Preparando tu documento...
Psychological Statistics Final Review Questions and Answers 2024 46. How do you find the area under the curve (by hand)?: The 'or' rule: P(A or B or ...etc) = P(A) + P(B) + etc 47. The normal distribution is like a because all the probabilities have to add up to .: Sample space, 1
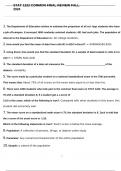
STAT 1222 COMMON FINAL REVIEW FALL 2024 4. The standard deviation of a data set measures the of the dataset.: variability 5. The score made by a particular student on a national standardized exam is the 75th percentile. This means that:
- Package deal
- Examen
- • 11 páginas's •
-
Statistics•Statistics
-
Statistics| Calculus| Homework exam elaborations bundle• Porsmartchoices
Vista previa 2 fuera de 11 páginas
Preparando tu documento...
STAT 1222 COMMON FINAL REVIEW FALL 2024 4. The standard deviation of a data set measures the of the dataset.: variability 5. The score made by a particular student on a national standardized exam is the 75th percentile. This means that:
ACF 100 General qs/ misc L11-21 |Que &Answers 5. An analyst has been charting previous 9 year's returns for a stock and displays the following results: 5%, 5%, 8%, 3%, 10%, 12%, 5%, 17% and 22%. If you were asked the mode of these returns, you would reply
- Package deal
- Examen
- • 24 páginas's •
-
Statistics•Statistics
-
Statistics| Calculus| Homework exam elaborations bundle• Porsmartchoices
Vista previa 3 fuera de 24 páginas
Preparando tu documento...
ACF 100 General qs/ misc L11-21 |Que &Answers 5. An analyst has been charting previous 9 year's returns for a stock and displays the following results: 5%, 5%, 8%, 3%, 10%, 12%, 5%, 17% and 22%. If you were asked the mode of these returns, you would reply
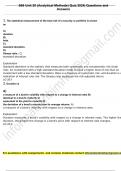
STATISTICS MILESTONE 5 EXAM 2024- 2025 WITH CORRECT ANSWERS AND VERIFIED QUESTIONS GRADED A+ Edwin conducted a survey to find the percentage of people in an area who smoked regularly. He defined the label "smoking regularly" for males smoking 30 or more cigarettes in a day and for females smoking 20 or more. Out of 635 persons who took part in the survey, 71 are labeled as people who smoke regularly. What is the standard error for the sample proportion? Answer choices are rounded to...
- Examen
- • 5 páginas's •
-
STATISTICS•STATISTICS
Vista previa 2 fuera de 5 páginas
Preparando tu documento...
STATISTICS MILESTONE 5 EXAM 2024- 2025 WITH CORRECT ANSWERS AND VERIFIED QUESTIONS GRADED A+ Edwin conducted a survey to find the percentage of people in an area who smoked regularly. He defined the label "smoking regularly" for males smoking 30 or more cigarettes in a day and for females smoking 20 or more. Out of 635 persons who took part in the survey, 71 are labeled as people who smoke regularly. What is the standard error for the sample proportion? Answer choices are rounded to...
Statistics QUESTIONS AND ANSWERS GRADE A+ Explain what is meant by extrapolation. (1 mark) Extrapolation is making predictions outside the original data range Explain the dangers of extrapolation. (1 mark) This is unreliable as the trend may not continue The ornithologist attempts to calculate the product moment correlation coefficient, r, and obtains a value of 1.3. Explain how she should be able to identify that this is incorrect without carrying out any further calculations. (1 mar...
- Examen
- • 11 páginas's •
-
Statistics•Statistics
Vista previa 2 fuera de 11 páginas
Preparando tu documento...
Statistics QUESTIONS AND ANSWERS GRADE A+ Explain what is meant by extrapolation. (1 mark) Extrapolation is making predictions outside the original data range Explain the dangers of extrapolation. (1 mark) This is unreliable as the trend may not continue The ornithologist attempts to calculate the product moment correlation coefficient, r, and obtains a value of 1.3. Explain how she should be able to identify that this is incorrect without carrying out any further calculations. (1 mar...
This essay describes Primary care-mental health integration as important in healthcare delivery, however, there is still a lack of integration between PCPs and MHPs.The work contains both dependent and independent variables
- Ensayo
- • 4 páginas's •
-
Statistics•Statistics
Vista previa 1 fuera de 4 páginas
Preparando tu documento...
This essay describes Primary care-mental health integration as important in healthcare delivery, however, there is still a lack of integration between PCPs and MHPs.The work contains both dependent and independent variables
INSTANTLY DOWNLOAD STATISTICAL DISCOVERING STATISTICS USING IBM SPSS STATISTICS PRACTICE TEST BANK
- Book
- Examen
- • 36 páginas's •
-
Statistics•Statistics
-
Discovering Statistics Using IBM SPSS Statistics • Andy Field• ISBN 9781446249178
Vista previa 4 fuera de 36 páginas
Preparando tu documento...
INSTANTLY DOWNLOAD STATISTICAL DISCOVERING STATISTICS USING IBM SPSS STATISTICS PRACTICE TEST BANK
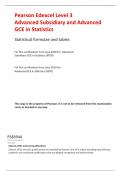
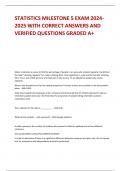
3 A Level in Statistics Population variance, σ 2 , = ∑x2 N − μ2 = N1 ∑(x − μ)2 Population standard deviation, σ, = ∑N x2 − μ2 = N1 ∑(x − μ)2 Sample variance, s 2 , = n 1− 1 2 (∑x)2 1 1 ∑(x − x)2 ∑x − n n − Sample standard deviation, s, = Binomial probability calculations: P(X = x) n x px (1 − p)n −x Binomial mean = np Binomial variance = np (1 − p) For a random sample of nx observations from N( μ , σ 2 ) 1 1 1 1 2 2 2 ...
- Notas de lectura
- • 32 páginas's •
-
statistics•statistics
Vista previa 4 fuera de 32 páginas
Preparando tu documento...
3 A Level in Statistics Population variance, σ 2 , = ∑x2 N − μ2 = N1 ∑(x − μ)2 Population standard deviation, σ, = ∑N x2 − μ2 = N1 ∑(x − μ)2 Sample variance, s 2 , = n 1− 1 2 (∑x)2 1 1 ∑(x − x)2 ∑x − n n − Sample standard deviation, s, = Binomial probability calculations: P(X = x) n x px (1 − p)n −x Binomial mean = np Binomial variance = np (1 − p) For a random sample of nx observations from N( μ , σ 2 ) 1 1 1 1 2 2 2 ...
descriptive statistics
- Examen
- • 5 páginas's •
-
statistics•statistics
Vista previa 2 fuera de 5 páginas
Preparando tu documento...
descriptive statistics
Full download please contact u84757(at)protonmail(dot)com or qidiantiku(dot)com
- Resumen
- • 31 páginas's •
-
Statistics•Statistics
Vista previa 4 fuera de 31 páginas
Preparando tu documento...
Full download please contact u84757(at)protonmail(dot)com or qidiantiku(dot)com