QMB 3200
Las últimas cargas en QMB 3200. ¿Buscando notas en QMB 3200? Tenemos muchas notas, guias de estudio y notas de estudio disponsible para tu escuela.
-
702
- 0
-
43
All courses for QMB 3200
-
QMB 3200 1
-
QMB 3200 702
-
QMB 3200 1
-
QMB-3200 4
Último contenido QMB 3200
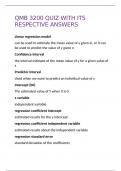
Linear regression model can be used to estimate the mean value of y given xi, or it can be used to predict the value of y given n Confidence interval the interval estimate of the mean value of y for a given value of x Predictor interval Used when we want to predict an individual value of y Intercept (b0) The estimated value of Y when X is 0 x variable independent variable regression coefficient intercept estimated results for the y intercept regression coefficient independent variabl...
- Package deal
- Examen
- • 7 páginas's •
-
QMB 3200•QMB 3200
-
QMB 3200 COMPILED REVISION MATERIALS• PorAcademicSuperStore
Vista previa 2 fuera de 7 páginas
Preparando tu documento...
Linear regression model can be used to estimate the mean value of y given xi, or it can be used to predict the value of y given n Confidence interval the interval estimate of the mean value of y for a given value of x Predictor interval Used when we want to predict an individual value of y Intercept (b0) The estimated value of Y when X is 0 x variable independent variable regression coefficient intercept estimated results for the y intercept regression coefficient independent variabl...
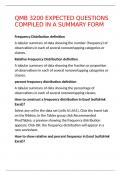
Frequency Distribution definition A tabular summary of data showing the number (frequency) of observations in each of several nonoverlapping categories or classes. Relative Frequency Distribution definition A tabular summary of data showing the fraction or proportion of observations in each of several nonoverlapping categories or classes. percent frequency distribution definition A tabular summary of data showing the percentage of observations in each of several nonoverlapping classes. How...
- Package deal
- Examen
- • 20 páginas's •
-
QMB 3200•QMB 3200
-
QMB 3200 COMPILED REVISION MATERIALS• PorAcademicSuperStore
Vista previa 3 fuera de 20 páginas
Preparando tu documento...
Frequency Distribution definition A tabular summary of data showing the number (frequency) of observations in each of several nonoverlapping categories or classes. Relative Frequency Distribution definition A tabular summary of data showing the fraction or proportion of observations in each of several nonoverlapping categories or classes. percent frequency distribution definition A tabular summary of data showing the percentage of observations in each of several nonoverlapping classes. How...
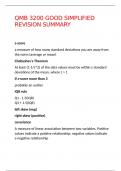
z-score a measure of how many standard deviations you are away from the norm (average or mean) Chebyshev's Theorem At least (1-1/z^2) of the data values must be within z standard deviations of the mean, where z > 1 if z-score more than 3 probably an outlier IQR rule Q1 - 1.5(IQR) Q3 + 1.5(IQR) left skew (neg) right skew (positive) covariance A measure of linear association between two variables. Positive values indicate a positive relationship; negative values indicate a negati...
- Package deal
- Resumen
- • 10 páginas's •
-
QMB 3200•QMB 3200
-
QMB 3200 COMPILED REVISION MATERIALS• PorAcademicSuperStore
Vista previa 2 fuera de 10 páginas
Preparando tu documento...
z-score a measure of how many standard deviations you are away from the norm (average or mean) Chebyshev's Theorem At least (1-1/z^2) of the data values must be within z standard deviations of the mean, where z > 1 if z-score more than 3 probably an outlier IQR rule Q1 - 1.5(IQR) Q3 + 1.5(IQR) left skew (neg) right skew (positive) covariance A measure of linear association between two variables. Positive values indicate a positive relationship; negative values indicate a negati...
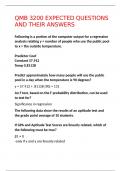
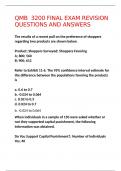
Following is a portion of the computer output for a regression analysis relating y = number of people who use the public pool to x = the outside temperature. Predictor Coef Constant 57.912 Temp 0.81138 Predict approximately how many people will use the public pool in a day when the temperature is 90 degrees? y = 57.912 + .81138 (90) = 131 An F test, based on the F probability distribution, can be used to test for? Significance in regression The following data show the results of an a...
- Package deal
- Examen
- • 28 páginas's •
-
QMB 3200•QMB 3200
-
QMB 3200 COMPILED REVISION MATERIALS• PorAcademicSuperStore
Vista previa 3 fuera de 28 páginas
Preparando tu documento...
Following is a portion of the computer output for a regression analysis relating y = number of people who use the public pool to x = the outside temperature. Predictor Coef Constant 57.912 Temp 0.81138 Predict approximately how many people will use the public pool in a day when the temperature is 90 degrees? y = 57.912 + .81138 (90) = 131 An F test, based on the F probability distribution, can be used to test for? Significance in regression The following data show the results of an a...
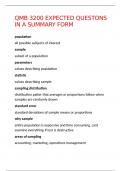
population all possible subjects of interest sample subset of a population parameters values describing population statistic values describing sample sampling distribution distribution patter that averages or proportions follow when samples are randomly drawn standard error standard deviations of sample means or proportions why sample entire population is expensive and time consuming, cant examine everything if test is destructive areas of sampling accounting,
- Package deal
- Examen
- • 9 páginas's •
-
QMB 3200•QMB 3200
-
QMB 3200 COMPILED REVISION MATERIALS• PorAcademicSuperStore
Vista previa 2 fuera de 9 páginas
Preparando tu documento...
population all possible subjects of interest sample subset of a population parameters values describing population statistic values describing sample sampling distribution distribution patter that averages or proportions follow when samples are randomly drawn standard error standard deviations of sample means or proportions why sample entire population is expensive and time consuming, cant examine everything if test is destructive areas of sampling accounting,
A population where each element of the population is assigned to one and only one of exactly two classes or categories is a Binomial Population Goodness of fit test utilizes Chi-square test A goodness of fit test is never conducted as a Lower tailed Test or a Two Tailed Test An important application of the chi-square distribution does not include: making inferences about two population variances A goodness of fit test is always An upper tailed test The degrees of freedom for a continge...
- Package deal
- Examen
- • 20 páginas's •
-
QMB 3200•QMB 3200
-
QMB 3200 COMPILED REVISION MATERIALS• PorAcademicSuperStore
Vista previa 3 fuera de 20 páginas
Preparando tu documento...
A population where each element of the population is assigned to one and only one of exactly two classes or categories is a Binomial Population Goodness of fit test utilizes Chi-square test A goodness of fit test is never conducted as a Lower tailed Test or a Two Tailed Test An important application of the chi-square distribution does not include: making inferences about two population variances A goodness of fit test is always An upper tailed test The degrees of freedom for a continge...
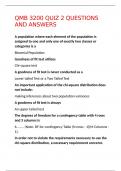
The results of a recent poll on the preference of shoppers regarding two products are shown below. Product; Shoppers Surveyed; Shoppers Favoring A; 800; 560 B; 900; 612 Refer to Exhibit 11-6. The 95% confidence interval estimate for the difference between the populations favoring the products is a. 0.6 to 0.7 b. -0.024 to 0.064 c. 0.02 to 0.3 d. 0.024 to 0.7 b. -0.024 to 0.064 When individuals in a sample of 150 were asked whether or not they supported capital punishment, the fol...
- Package deal
- Examen
- • 23 páginas's •
-
QMB 3200•QMB 3200
-
QMB 3200 COMPILED REVISION MATERIALS• PorAcademicSuperStore
Vista previa 3 fuera de 23 páginas
Preparando tu documento...
The results of a recent poll on the preference of shoppers regarding two products are shown below. Product; Shoppers Surveyed; Shoppers Favoring A; 800; 560 B; 900; 612 Refer to Exhibit 11-6. The 95% confidence interval estimate for the difference between the populations favoring the products is a. 0.6 to 0.7 b. -0.024 to 0.064 c. 0.02 to 0.3 d. 0.024 to 0.7 b. -0.024 to 0.064 When individuals in a sample of 150 were asked whether or not they supported capital punishment, the fol...

Dataset all the data collected for a particular analysis. Element the entity on which data is collected. Variable a characteristic of interest of an element. Observation the variables associated with an individual element. Categorical use numeric or ordinal values of measurement of categories. Quantitative use numeric (quantitative) measures. Cross-sectional data collected at a similar point in time. Time Series data collected over several time periods. Panel combination of cros...
- Package deal
- Resumen
- • 19 páginas's •
-
QMB 3200•QMB 3200
-
QMB 3200 COMPILED REVISION MATERIALS• PorAcademicSuperStore
Vista previa 3 fuera de 19 páginas
Preparando tu documento...
Dataset all the data collected for a particular analysis. Element the entity on which data is collected. Variable a characteristic of interest of an element. Observation the variables associated with an individual element. Categorical use numeric or ordinal values of measurement of categories. Quantitative use numeric (quantitative) measures. Cross-sectional data collected at a similar point in time. Time Series data collected over several time periods. Panel combination of cros...
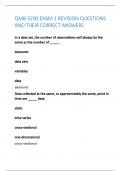
In a data set, the number of observations will always be the same as the number of _____. elements data sets variables data elements Data collected at the same, or approximately the same, point in time are _____ data. static time series cross-sectional one-dimensional cross-sectional When the data are labels or names used to identify an attribute of the elements, the variable has which scale of measurement? interval ordinal nominal ratio nominal The enti...
- Package deal
- Examen
- • 18 páginas's •
-
QMB 3200•QMB 3200
-
QMB 3200 COMPILED REVISION MATERIALS• PorAcademicSuperStore
Vista previa 3 fuera de 18 páginas
Preparando tu documento...
In a data set, the number of observations will always be the same as the number of _____. elements data sets variables data elements Data collected at the same, or approximately the same, point in time are _____ data. static time series cross-sectional one-dimensional cross-sectional When the data are labels or names used to identify an attribute of the elements, the variable has which scale of measurement? interval ordinal nominal ratio nominal The enti...
data the facts & figures collected, analyzed, & summarized for presentation & interpretation dataset all the data collected for a particular analysis element the entity on which data is collected variable a characteristic of interest of an element observation the variables associated with an individual element categorical data uses numeric or ordinal values of measurement of categories quantitative data use numeric (quantitative) measures cross-sectional data collected at a simila...
- Package deal
- Resumen
- • 12 páginas's •
-
QMB 3200•QMB 3200
-
QMB 3200 COMPILED REVISION MATERIALS• PorAcademicSuperStore
Vista previa 2 fuera de 12 páginas
Preparando tu documento...
data the facts & figures collected, analyzed, & summarized for presentation & interpretation dataset all the data collected for a particular analysis element the entity on which data is collected variable a characteristic of interest of an element observation the variables associated with an individual element categorical data uses numeric or ordinal values of measurement of categories quantitative data use numeric (quantitative) measures cross-sectional data collected at a simila...