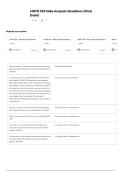
MKTG 525 Data Analysis Questions (Final
Exam)
Save
Students also studied
MKTG 525 - Sampling (Final Exam) MKTG 525 - Data Coding & Editing (... MKTG 525 - Descriptive Data Analys... MKTG 5
41 terms 17 terms 26 terms 12 terms
kendallprince Preview kendallprince Preview kendallprince Preview ken
What proportion of students in the sample report using Frequency (Proportion)
Facebook (Q1A)? Repeat for each social media platform
Q1B-Q1H.
According to a poll of adults aged 18-29 conducted by Chi-square Goodness of Fit Test
Pew Research in 2023, 78% reported using Instagram,
65% Snapchat, 62% TikTok, 42% X (Twitter), 93% YouTube,
32% LinkedIn, and 67% Facebook. Testing each platform
individually, are Ole Miss students more or less likely to
use these apps than the general young adult population?
For example, are Ole Miss students more or less likely to
use Instagram than the general US young adult
population (Q1C)? Repeat this analysis for each platform
named above.
Are men or women more likely to use Facebook (Q22, Chi-square Test of Independence
Q1A)? Repeat for each social media platform Q1B-Q1H.
Which year in school is more likely to use LinkedIn (Q26, Chi-square Test of Independence
Q1E)?
Are Greek or non-Greek students more likely to use Chi-square Test of Independence
Facebook (Q25, Q1A)? Repeat for each social media
platform Q1B-Q1H.
Are domestic or international students more likely to use Chi-square Test of Independence
Facebook (Q28, Q1A)? Repeat for each social media
platform Q1B-Q1H.
, Is there a relationship between a student's year in school Chi-square Test of Independence
and whether or not they use dating apps (Q26, Q1H)? Is
there a relationship between whether students live on- or
off-campus and whether or not they use dating apps
(Q27, Q1H)?
On average, how often do students in the sample report Mean
using any form of social media (Q3)?
Do students report using Facebook more than once per One-Way T-test
day (Q2A)? Repeat for each platform Q2B-Q2E.
Do students report using Instagram or Snapchat more Paired Samples T-Test
often (Q2B, Q2D)? Do students use Instagram or TikTok
more often (Q2B, Q2E)?
We can look to see if the state's ban on TikTok on Independent Samples (Two-Way) T-test
government-run Wi-Fi has limited TikTok use among
students on campus. Do students who live on- or off-
campus report using TikTok more often (Q27, Q2E)?
Who looks at social media more often: men or women Independent Samples (Two-Way) T-test
(Q22, Q3)? Greek or non-Greek students (Q25, Q3)?
Domestic or International students (Q28, Q3)? Black
students or white students (Q29, Q3)?
Is there a relationship between students' age and how Bivariate Correlation
often they look at social media (Q23, Q3)?
Do students agree that they use social media for social One-Way T-Test
connection (SocialConnection)? Repeat for the other
broad benefits Self-Expression, Learning,
Professional/Academic, Leisure, and Practical Benefits.
Are students more likely to report using social media for Paired Samples T-Test
leisure benefits or for social connection benefits (Leisure,
SocialConnection)? Are students more likely to report
using social media for leisure benefits or for
professional/academic benefits (Leisure,
ProfessionalAcademic)?
Is there a relationship between student age and the Bivariate Correlation
extent to which they report using social media to gain
Professional or Academic benefits (Q23,
ProfessionalAcademic)?
Is there a relationship between student age and the Bivariate Correlation
extent to which they report using social media for Leisure
benefits (Q23, Leisure)?
Exam)
Save
Students also studied
MKTG 525 - Sampling (Final Exam) MKTG 525 - Data Coding & Editing (... MKTG 525 - Descriptive Data Analys... MKTG 5
41 terms 17 terms 26 terms 12 terms
kendallprince Preview kendallprince Preview kendallprince Preview ken
What proportion of students in the sample report using Frequency (Proportion)
Facebook (Q1A)? Repeat for each social media platform
Q1B-Q1H.
According to a poll of adults aged 18-29 conducted by Chi-square Goodness of Fit Test
Pew Research in 2023, 78% reported using Instagram,
65% Snapchat, 62% TikTok, 42% X (Twitter), 93% YouTube,
32% LinkedIn, and 67% Facebook. Testing each platform
individually, are Ole Miss students more or less likely to
use these apps than the general young adult population?
For example, are Ole Miss students more or less likely to
use Instagram than the general US young adult
population (Q1C)? Repeat this analysis for each platform
named above.
Are men or women more likely to use Facebook (Q22, Chi-square Test of Independence
Q1A)? Repeat for each social media platform Q1B-Q1H.
Which year in school is more likely to use LinkedIn (Q26, Chi-square Test of Independence
Q1E)?
Are Greek or non-Greek students more likely to use Chi-square Test of Independence
Facebook (Q25, Q1A)? Repeat for each social media
platform Q1B-Q1H.
Are domestic or international students more likely to use Chi-square Test of Independence
Facebook (Q28, Q1A)? Repeat for each social media
platform Q1B-Q1H.
, Is there a relationship between a student's year in school Chi-square Test of Independence
and whether or not they use dating apps (Q26, Q1H)? Is
there a relationship between whether students live on- or
off-campus and whether or not they use dating apps
(Q27, Q1H)?
On average, how often do students in the sample report Mean
using any form of social media (Q3)?
Do students report using Facebook more than once per One-Way T-test
day (Q2A)? Repeat for each platform Q2B-Q2E.
Do students report using Instagram or Snapchat more Paired Samples T-Test
often (Q2B, Q2D)? Do students use Instagram or TikTok
more often (Q2B, Q2E)?
We can look to see if the state's ban on TikTok on Independent Samples (Two-Way) T-test
government-run Wi-Fi has limited TikTok use among
students on campus. Do students who live on- or off-
campus report using TikTok more often (Q27, Q2E)?
Who looks at social media more often: men or women Independent Samples (Two-Way) T-test
(Q22, Q3)? Greek or non-Greek students (Q25, Q3)?
Domestic or International students (Q28, Q3)? Black
students or white students (Q29, Q3)?
Is there a relationship between students' age and how Bivariate Correlation
often they look at social media (Q23, Q3)?
Do students agree that they use social media for social One-Way T-Test
connection (SocialConnection)? Repeat for the other
broad benefits Self-Expression, Learning,
Professional/Academic, Leisure, and Practical Benefits.
Are students more likely to report using social media for Paired Samples T-Test
leisure benefits or for social connection benefits (Leisure,
SocialConnection)? Are students more likely to report
using social media for leisure benefits or for
professional/academic benefits (Leisure,
ProfessionalAcademic)?
Is there a relationship between student age and the Bivariate Correlation
extent to which they report using social media to gain
Professional or Academic benefits (Q23,
ProfessionalAcademic)?
Is there a relationship between student age and the Bivariate Correlation
extent to which they report using social media for Leisure
benefits (Q23, Leisure)?