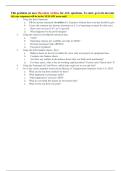
This problem set uses Hawaiian Airlines for ALL questions. To start, go to its investor relati
All your responses will be in the YELLOW areas only!
1. Using the firm's financials:
a. Fill the income statement (in million $ ). Expenses without their own line should be grouped un
b. Create the common size income statement (as a % of operating revenues for that year)
c. Show year-on-year (YoY, in %) growth
d. What happened to the profit margins?
2. Using the selected consolidated statistical data:
a. Yield?
b. Operating expense per available seat mile (CASM)?
c. Revenue passenger miles (RPMs)?
d. Fuel price ($/gallon)?
3. Using the firm's balance sheets, show:
a. Balance sheets as shown (in million $); show only net property & equipment lines.
b. Common size balance sheets.
c. Are there any outliers in the balance sheets that you think merit mentioning?
d. For these years, what is the net working capital position? Current ratio? Quick ratio? Days rec
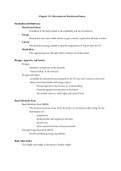
4. Using the Statement of Cash Flows, which items stand out to you and why?
5. Go to the carrier snapshot section in the Bureau of Transportation Statistics of the U.S. DOT:
a. What are the top three markets by share?
b. What happened to passenger yields?
c. What happened to costs per ASM?
d. What do you think this means for the bottom line?
e. What are the top three city pairs?
,s investor relations page and get its latest annual report (10-K). Make sure to use the last 3 full years!
ould be grouped under "All other expenses". The net income lines must tie using formulas
ick ratio? Days receivable? Return on assets (ROA)? Return on equity (ROE)? What is the latest p/e ratio? (use Yahoo Financ
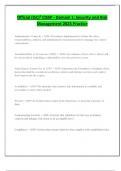
All your responses will be in the YELLOW areas only!
1. Using the firm's financials:
a. Fill the income statement (in million $ ). Expenses without their own line should be grouped un
b. Create the common size income statement (as a % of operating revenues for that year)
c. Show year-on-year (YoY, in %) growth
d. What happened to the profit margins?
2. Using the selected consolidated statistical data:
a. Yield?
b. Operating expense per available seat mile (CASM)?
c. Revenue passenger miles (RPMs)?
d. Fuel price ($/gallon)?
3. Using the firm's balance sheets, show:
a. Balance sheets as shown (in million $); show only net property & equipment lines.
b. Common size balance sheets.
c. Are there any outliers in the balance sheets that you think merit mentioning?
d. For these years, what is the net working capital position? Current ratio? Quick ratio? Days rec
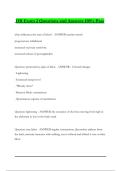
4. Using the Statement of Cash Flows, which items stand out to you and why?
5. Go to the carrier snapshot section in the Bureau of Transportation Statistics of the U.S. DOT:
a. What are the top three markets by share?
b. What happened to passenger yields?
c. What happened to costs per ASM?
d. What do you think this means for the bottom line?
e. What are the top three city pairs?
,s investor relations page and get its latest annual report (10-K). Make sure to use the last 3 full years!
ould be grouped under "All other expenses". The net income lines must tie using formulas
ick ratio? Days receivable? Return on assets (ROA)? Return on equity (ROE)? What is the latest p/e ratio? (use Yahoo Financ