MATH 302 Final Exam 2 - Question and Answers | VERIFIED SOLUTION
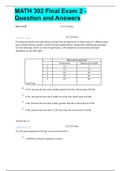
MATH 302 Final Exam 2 - Question and Answers Part 1 of 16 - 2.0/ 2.0 Points Question 1 of 23 1.0/ 1.0 Points The data presented in the table below resulted from an experiment in which seeds of 5 different types were planted and the number of seeds that germinated within 5 weeks after planting was recorded for each seed type. At the .01 level of significance, is the proportion of seeds that germinate dependent on the seed type? Seed Type Observed Frequencies Germinated Failed to Germinate 1 31 7 2 57 33 3 87 60 4 52 44 5 10 19 A.Yes, because the test value 16.86 is greater than the critical value of 13.28 B.Yes, because the test value 16.86 is less than the critical value of 14.86 C.No, because the test value 16.86 is greater than the critical value of 13.28 D.No, because the test value 13.28 is less than the critical value of 16.86 Question 2 of 23 1.0/ 1.0 Points The chi-square goodness-of-fit test can be used to test for: A.difference between population means MATH 302 Final Exam 2 - Question and Answers B.difference between population variances C.normality D.significance of sample statistics Part 2 of 16 - 3.0/ 3.0 Points Question 3 of 23 1.0/ 1.0 Points A linear regression analysis produces the equation y = 5.32 + (-0.846)x Which of the following statements must be true? A.As x increases, y decreases, and the correlation coefficient must be positive. B.As x increases, y increases, and the correlation coefficient must be positive. C.As x increases, y decreases, and the correlation coefficient must be negative. D.As x increases, y increases, and the correlation coefficient must be negative. Question 4 of 23 1.0/ 1.0 Points In a simple linear regression analysis, the following sum of squares are produced: MATH 302 Final Exam 2 - Question and Answers = 400 = 80 = 320 The proportion of the variation in Y that is explained by the variation in X is: A.20% B.50% C.80% D.25% Question 5 of 23 1.0/ 1.0 Points The city of Oakdale wishes to see if there is a linear relationship between the temperature and the amount of electricity used (in kilowatts). Based on the data in the table below, is there a significant linear relationship between temperature and the amount of electricity used? These d
Escuela, estudio y materia
- Institución
- Chamberlain College Of Nursing
- Grado
- MATH 302
Información del documento
- Subido en
- 18 de febrero de 2021
- Número de páginas
- 16
- Escrito en
- 2020/2021
- Tipo
- Examen
- Contiene
- Preguntas y respuestas
Temas
-
math 302 final exam 2 question and answers part 1 of 16 20 20 points question 1 of 23 10 10 points the data presented in the table below resulted from an experiment in which seeds of 5 diffe

Documento también disponible en un lote